Consumer product company, Boston

Weave built technology to bring people together in real life.

Over two years the team shipped three consumer products, grew past 10,000 student signups with no paid media, and used funnel and cohort analysis to reach a clear conclusion about the economics of the category. This page documents the thesis, the products, the evidence and the decision.

10,000+
Student signups across campuses
$0
Spent on paid advertising
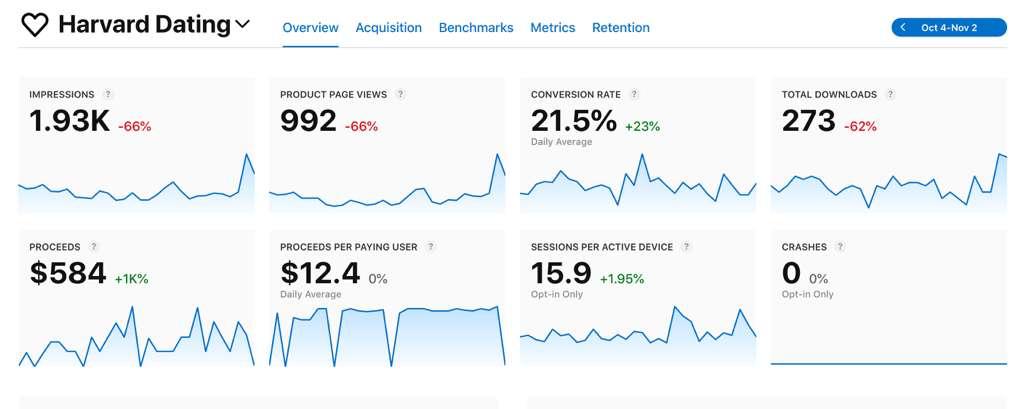
21.5%
Peak App Store page conversion
15.9
Weekly sessions per active device
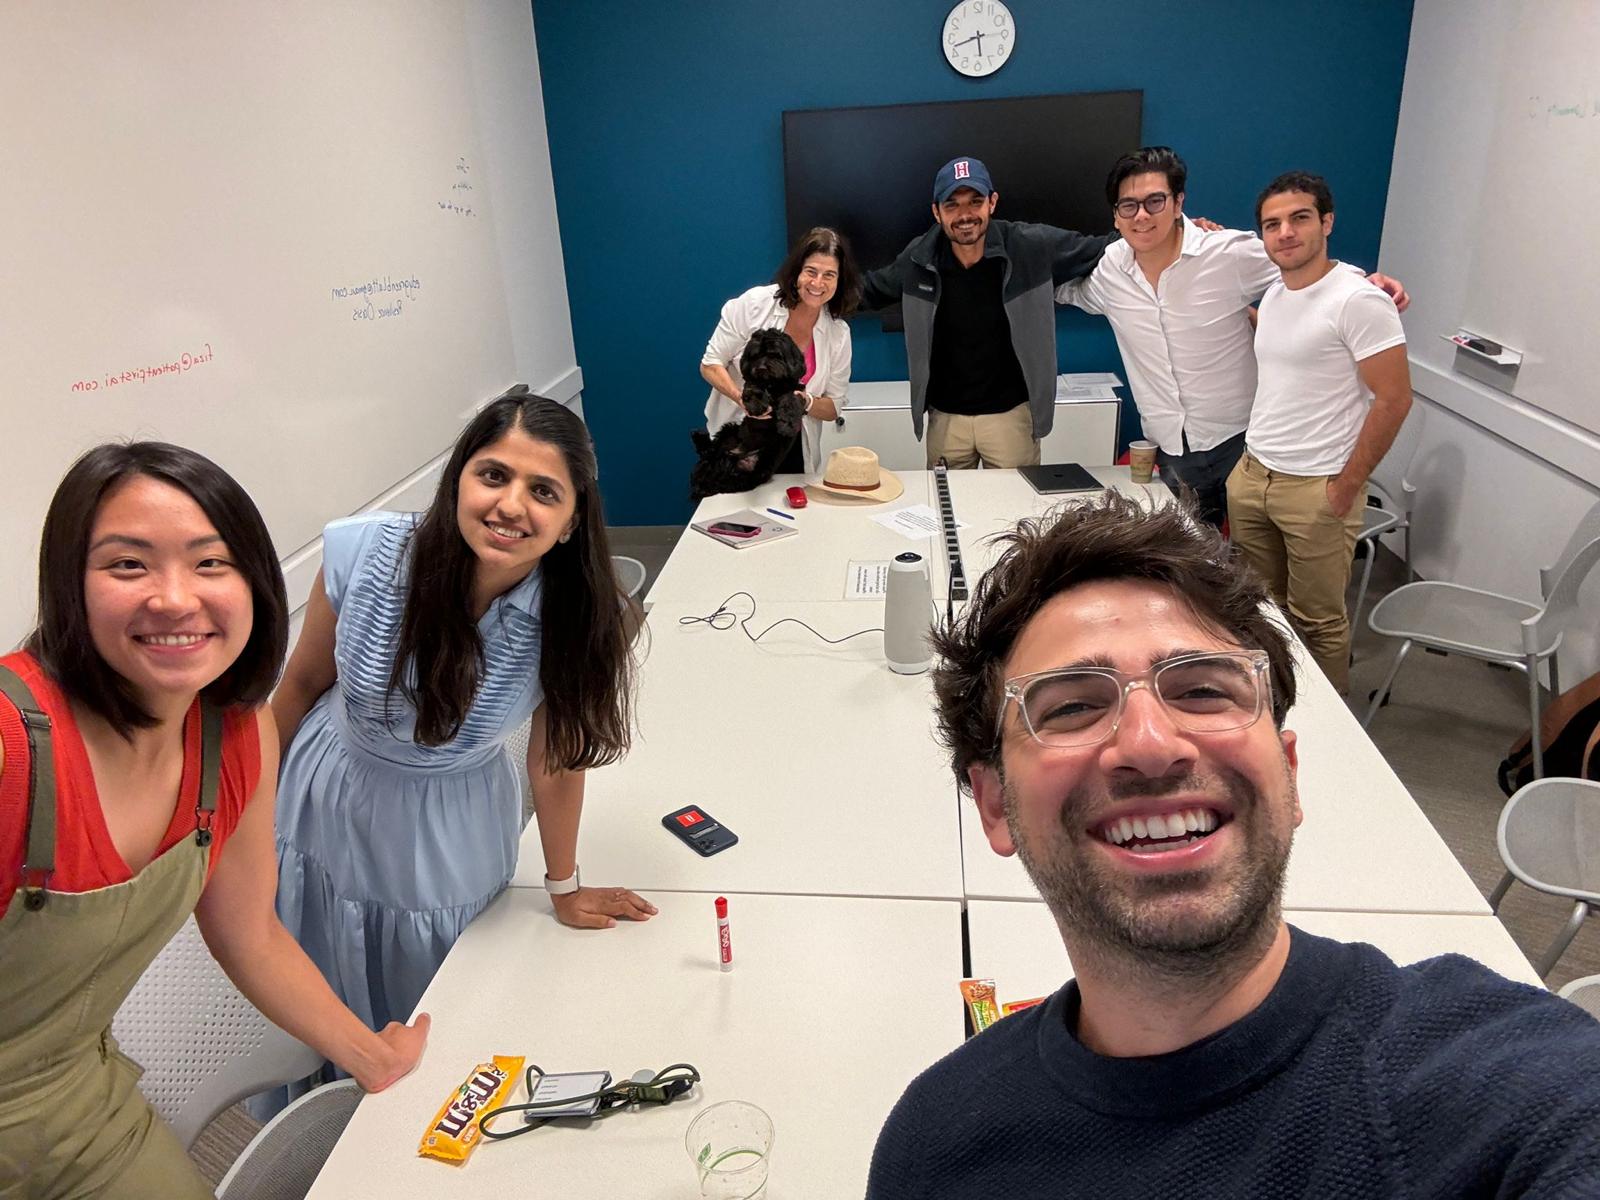
The Weave team in a working session at the Harvard i-lab
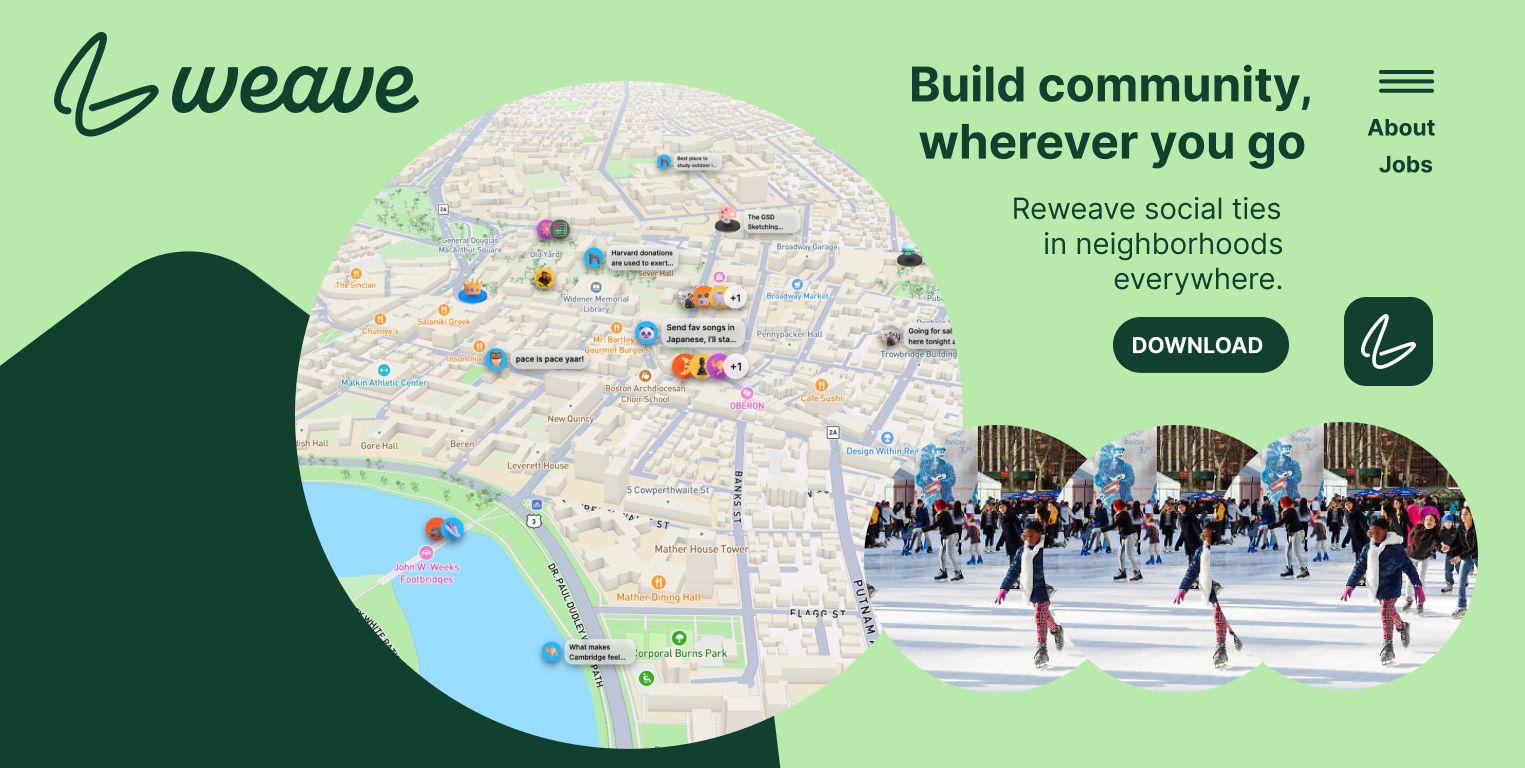
The Weave website, build community wherever you go

The team at the Harvard i-lab, and the Weave Community launch site.

The problem

Loneliness is a measurable public health problem, and the people most affected are the most digitally connected.

“Loneliness is far more than just a bad feeling. It harms both individual and societal health. Our relationships are a source of healing and well being hiding in plain sight.”

Dr. Vivek Murthy, United States Surgeon General, Advisory on the Healing Effects of Social Connection, 2023

The Surgeon General’s advisory reported that about one in two American adults experience measurable loneliness, and that adults aged 18 to 24 report the highest rates of any age group. It compared the mortality impact of chronic isolation to smoking up to fifteen cigarettes a day.

Weave started from one question. Students live surrounded by peers and still report record isolation, so can digital tools move people from a screen to a room together rather than deeper into a feed.

Community in practice

The thesis was tested offline as much as in the product.

The team hosted meetups and events through Weave, ran focus groups at the Harvard i-lab, and studied how shared public space creates connection.

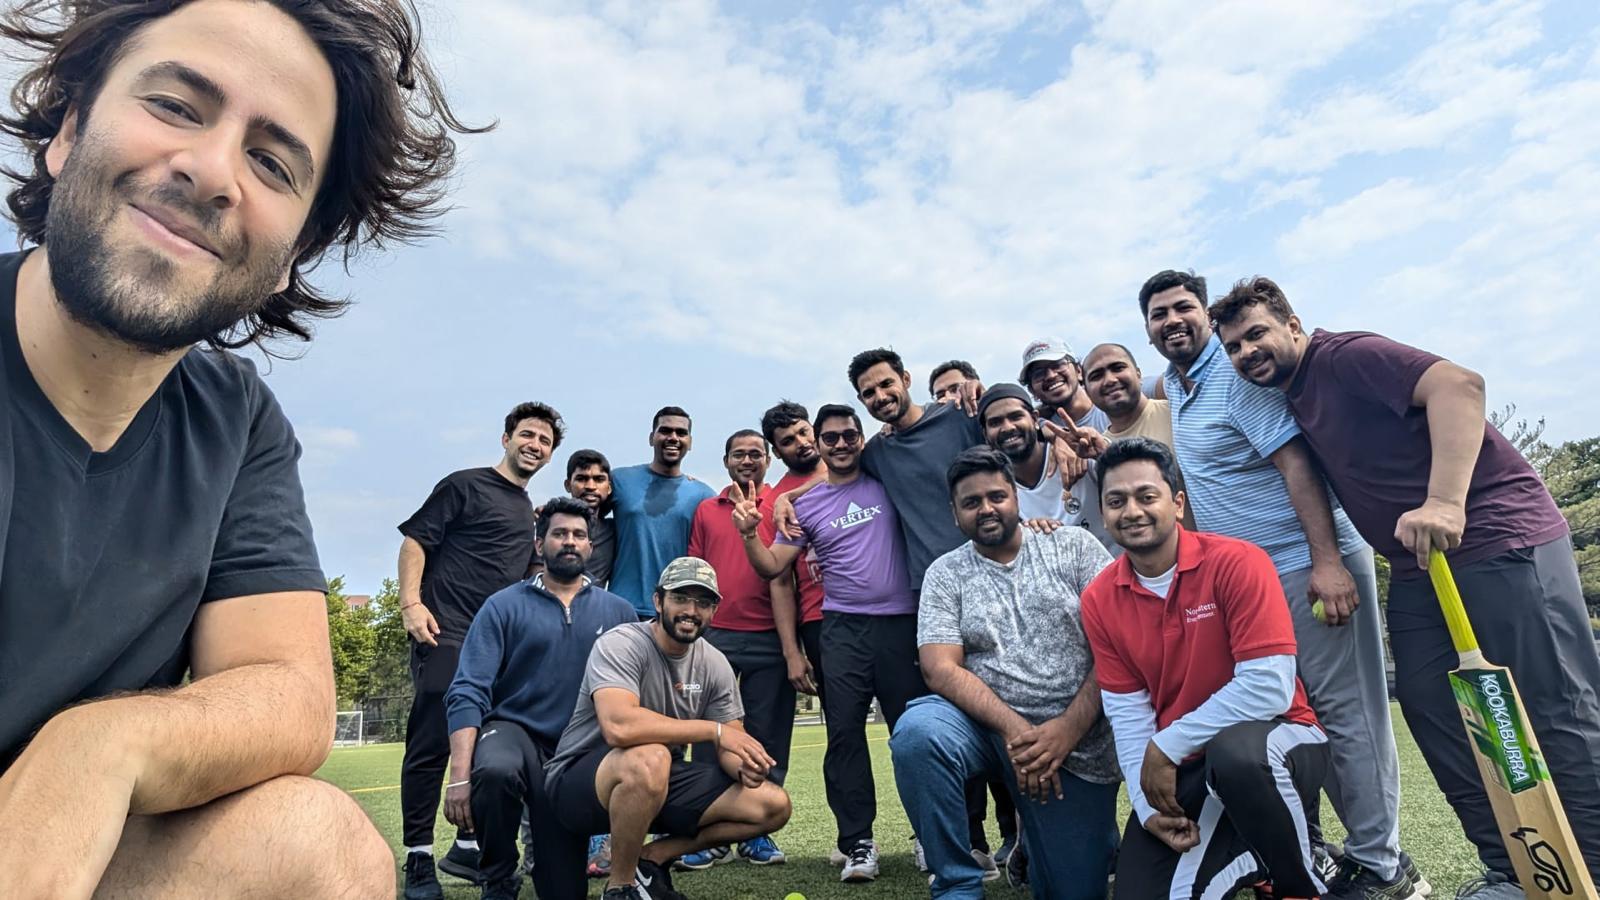
A Weave community cricket meetup in Cambridge
A cricket meetup organized through the Weave community in Cambridge.
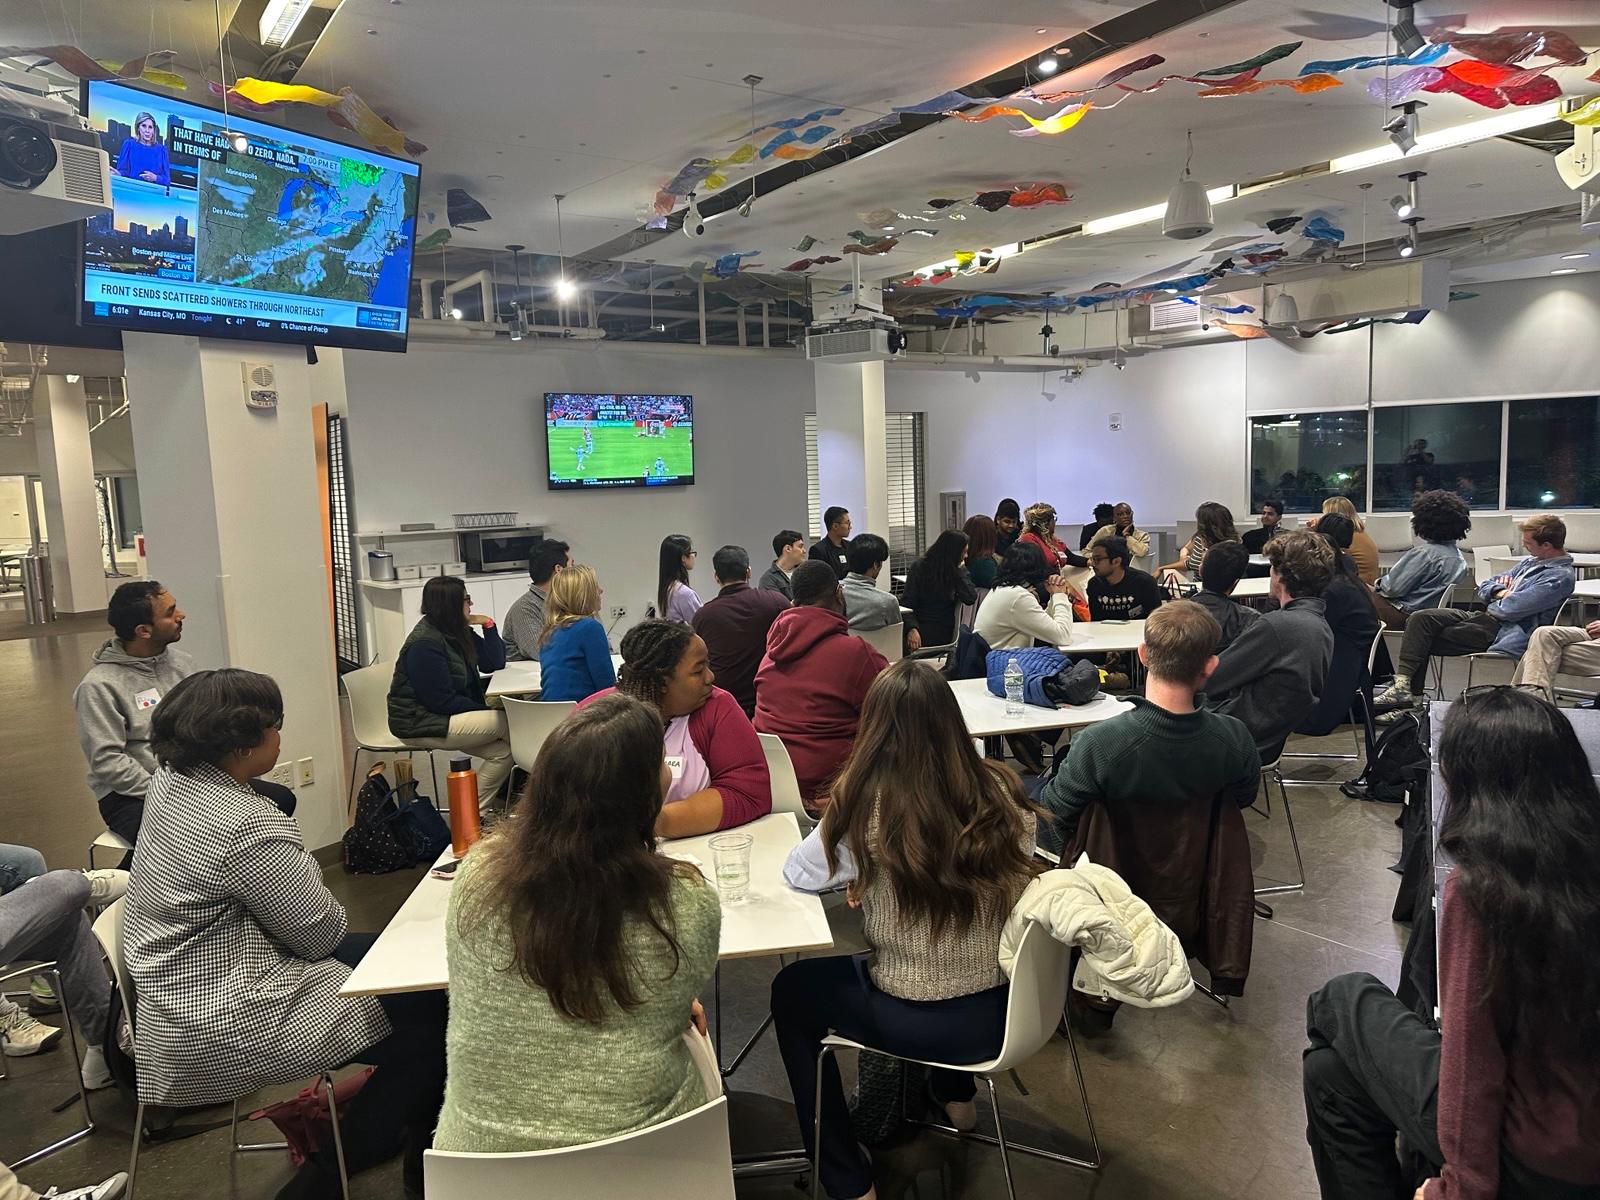
A full room at a Weave community event at the Harvard i-lab
A Weave community event at the Harvard i-lab. Events and meetups were a core part of how the product was tested.
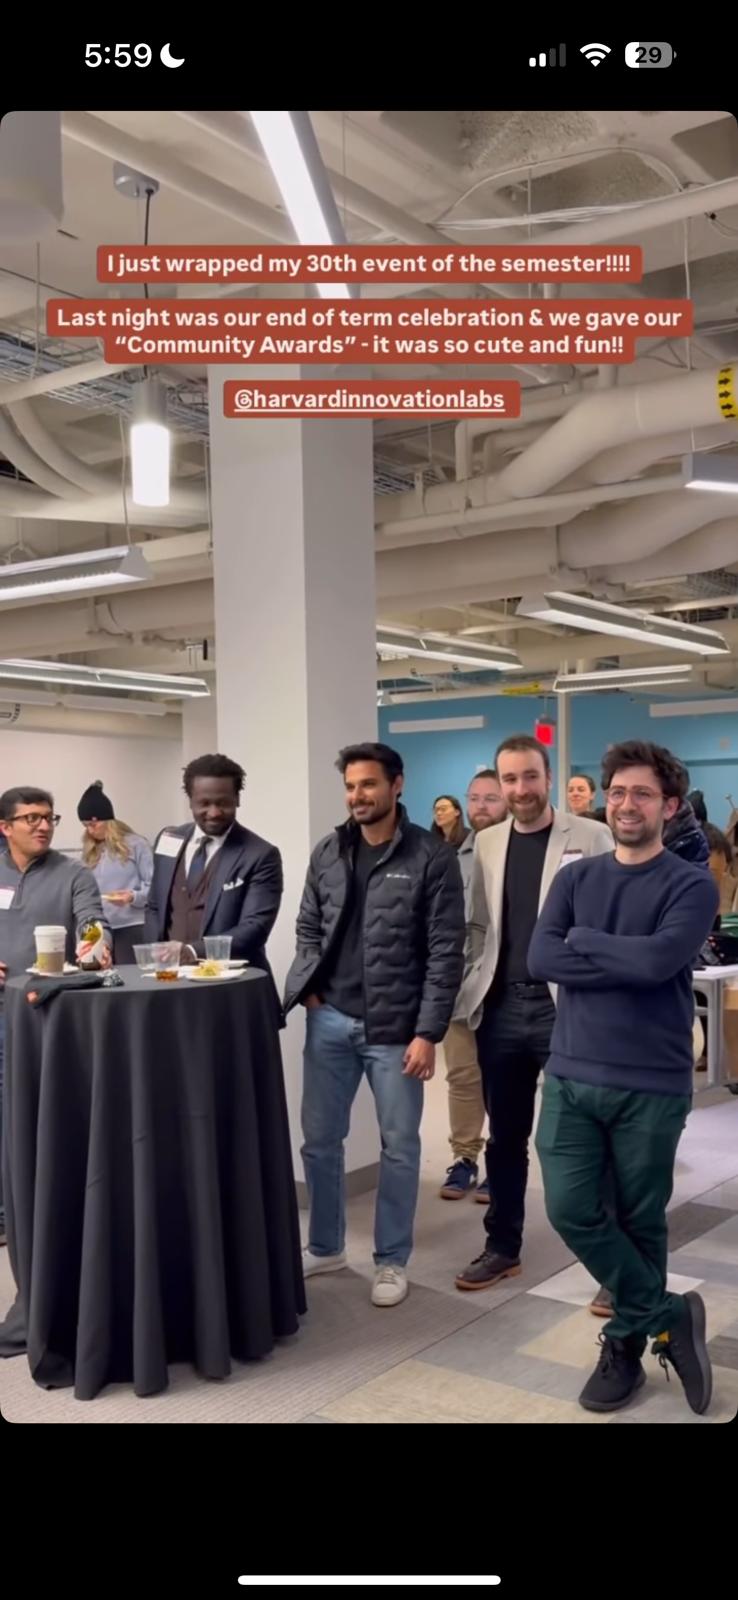
End of term community awards celebration at the Harvard i-lab
End of term celebration and Community Awards at the Harvard i-lab, one of thirty events hosted that semester.
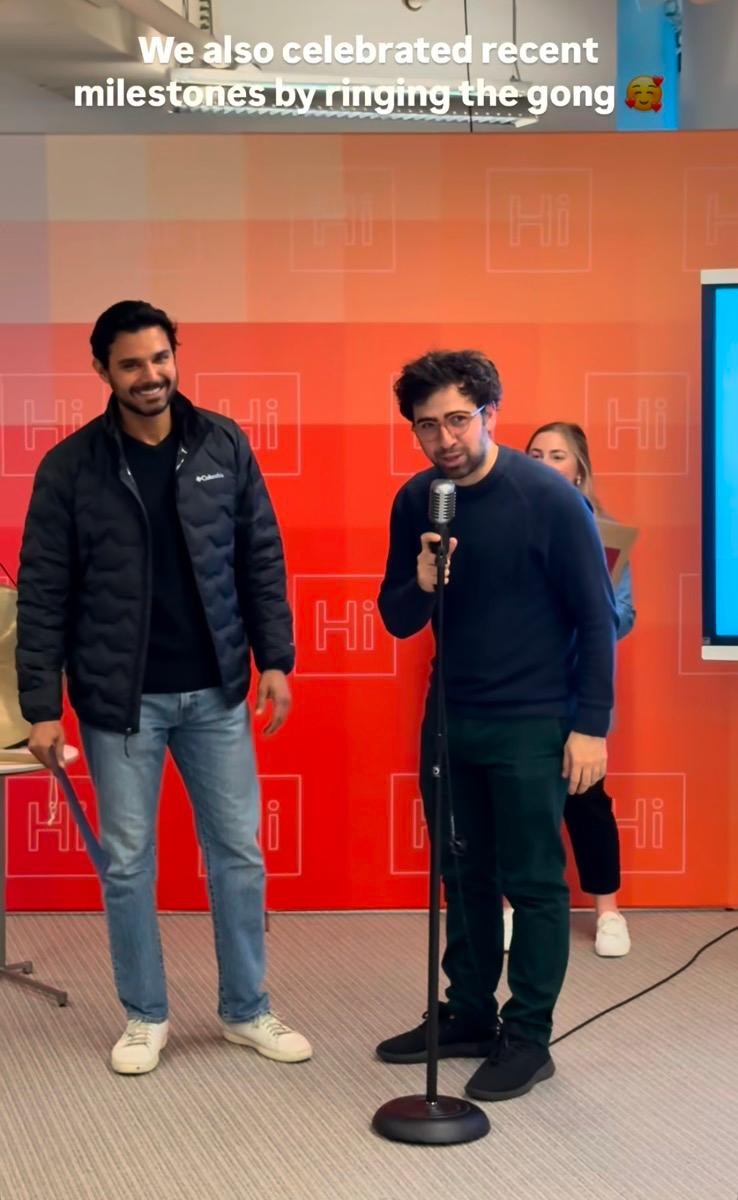
Team members celebrating a milestone at the i-lab
Celebrating product milestones at the i-lab.
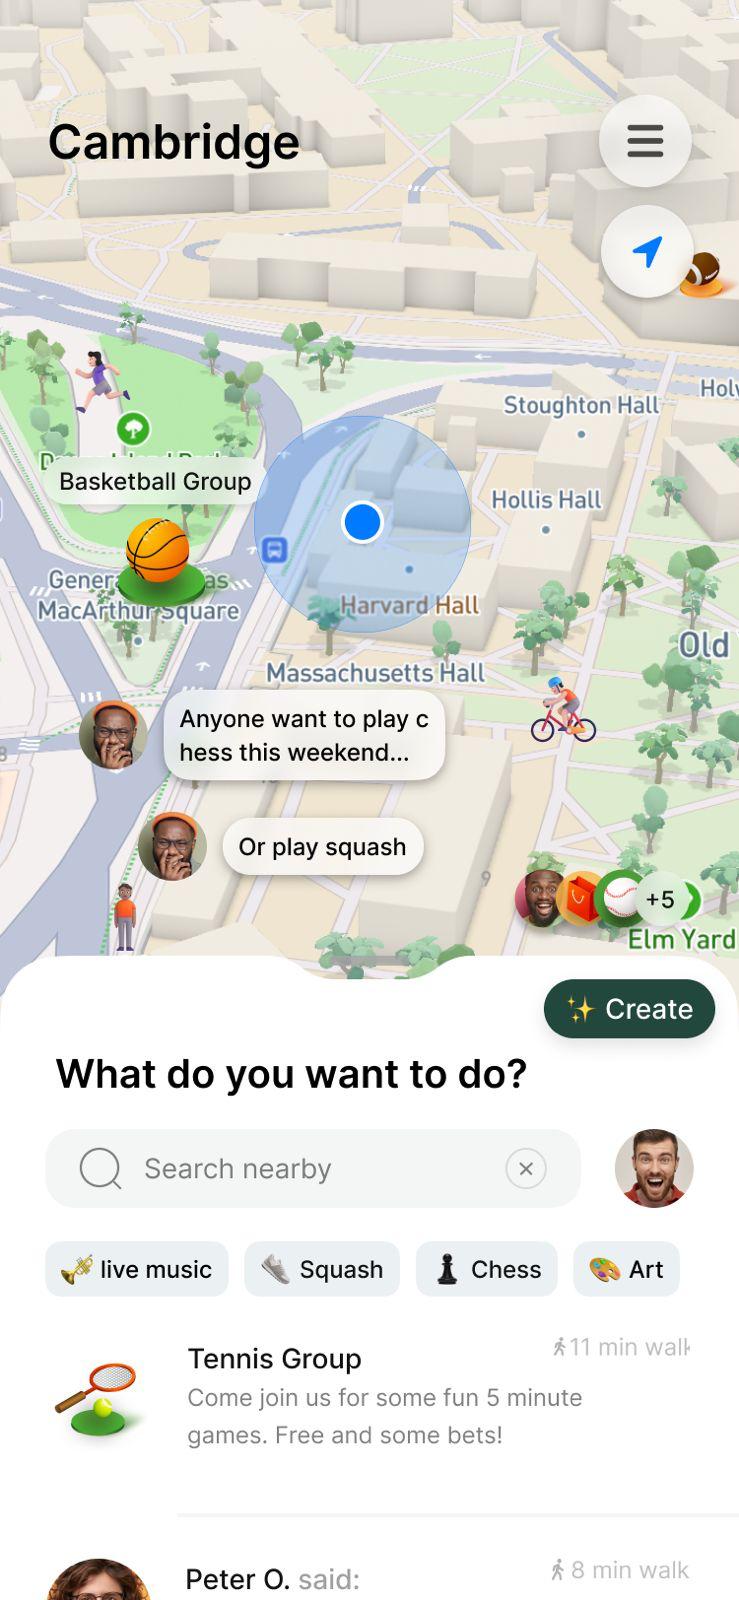
Early iteration of the Weave app map interface
An early iteration of the Weave app. The map based feed went through many redesigns across twelve months.
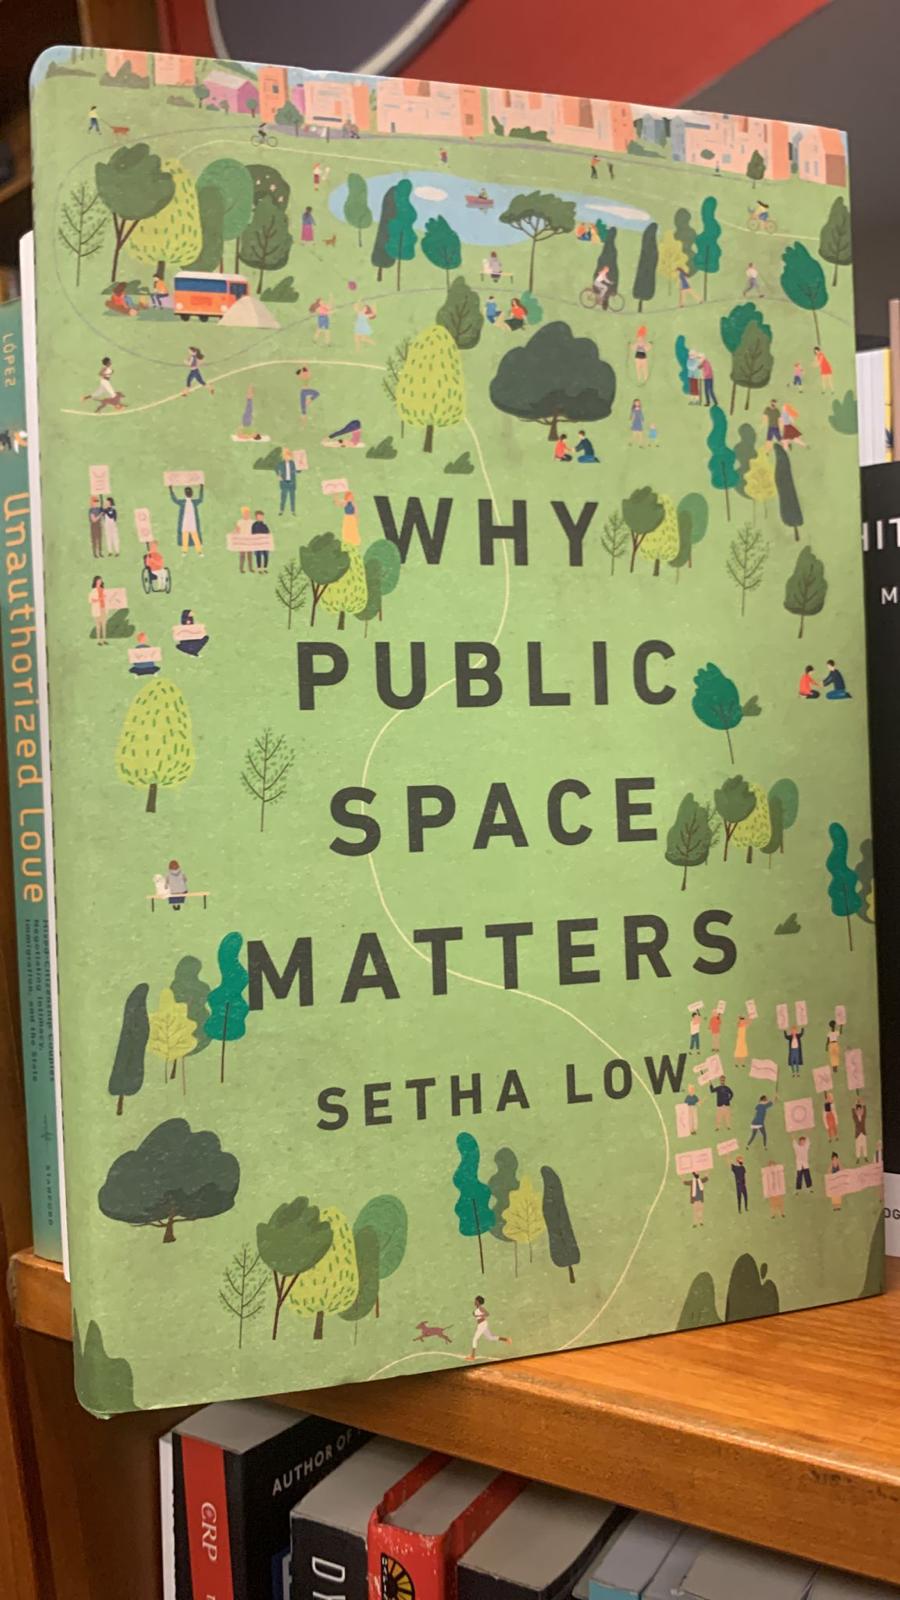
The book Why Public Space Matters by Setha Low
Reading that shaped the thesis. Why Public Space Matters informed the focus on shared physical space.

Product evolution

Three products, each one a narrower and more testable version of the same hypothesis.

The sequence matters more than any single launch. Each product was scoped by what the previous product's data ruled out.

Weave Community icon

Weave Community

12 months

A neighborhood social graph. Map based local posts, interest groups, events and conversations in one app.

Outcome
Shipped to the App Store and iterated for roughly twelve months. Strong signal on intent, weak signal on repeat use.
What it settled
A broad social product without a single daily job hits a retention ceiling. Breadth was the constraint, not design quality.
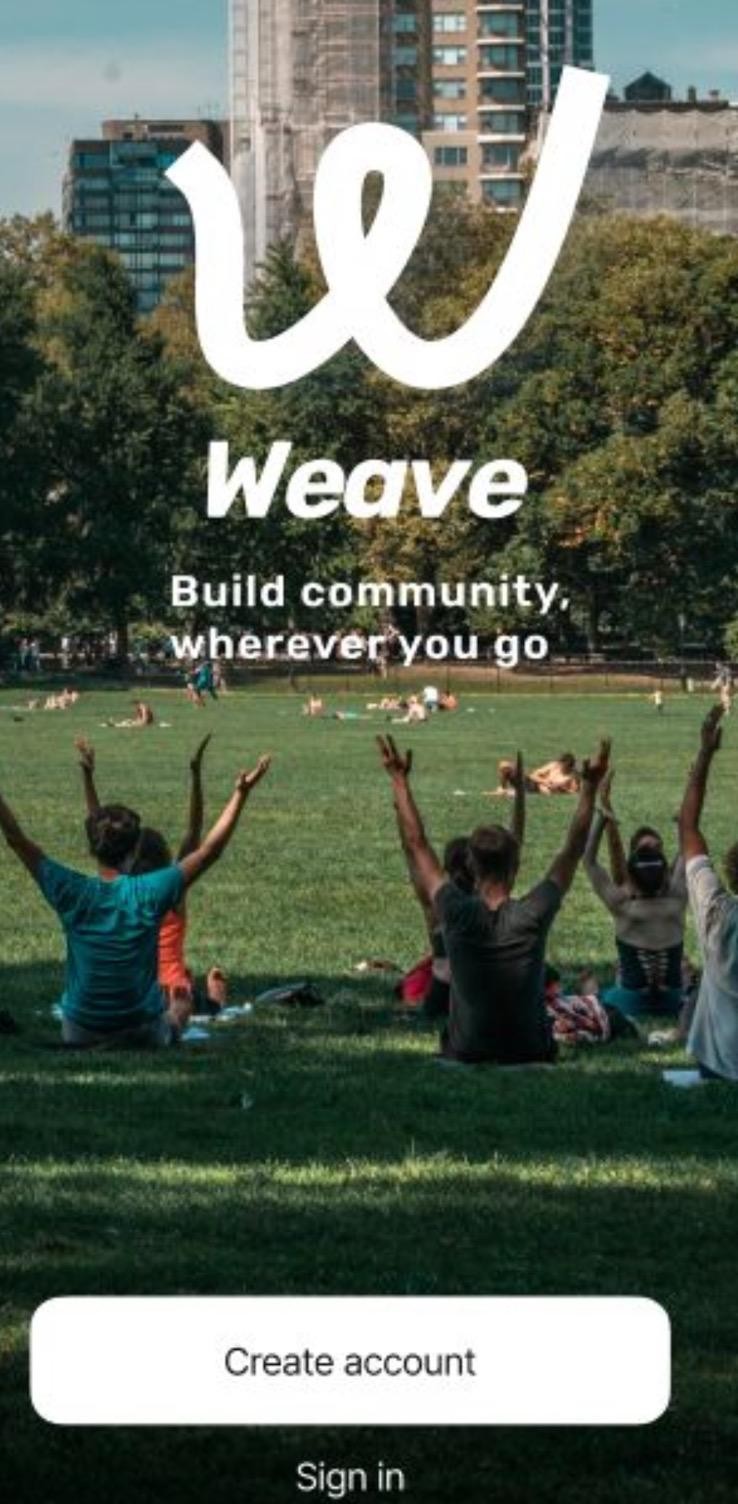
The Weave app welcome screen over a photo of a community gathering in a park
The Weave welcome screen. The brand put real community gatherings at the center of the product story.
Remy Social Calendar icon

Remy Social Calendar

2024

Every Harvard event in one place. Aggregated fragmented school, club and department calendars into a single feed.

Outcome
Narrower scope produced materially better repeat usage than the broad community app.
What it settled
Utility beats community as a wedge. The cost to operate a calendar campus by campus did not support the revenue it could carry.
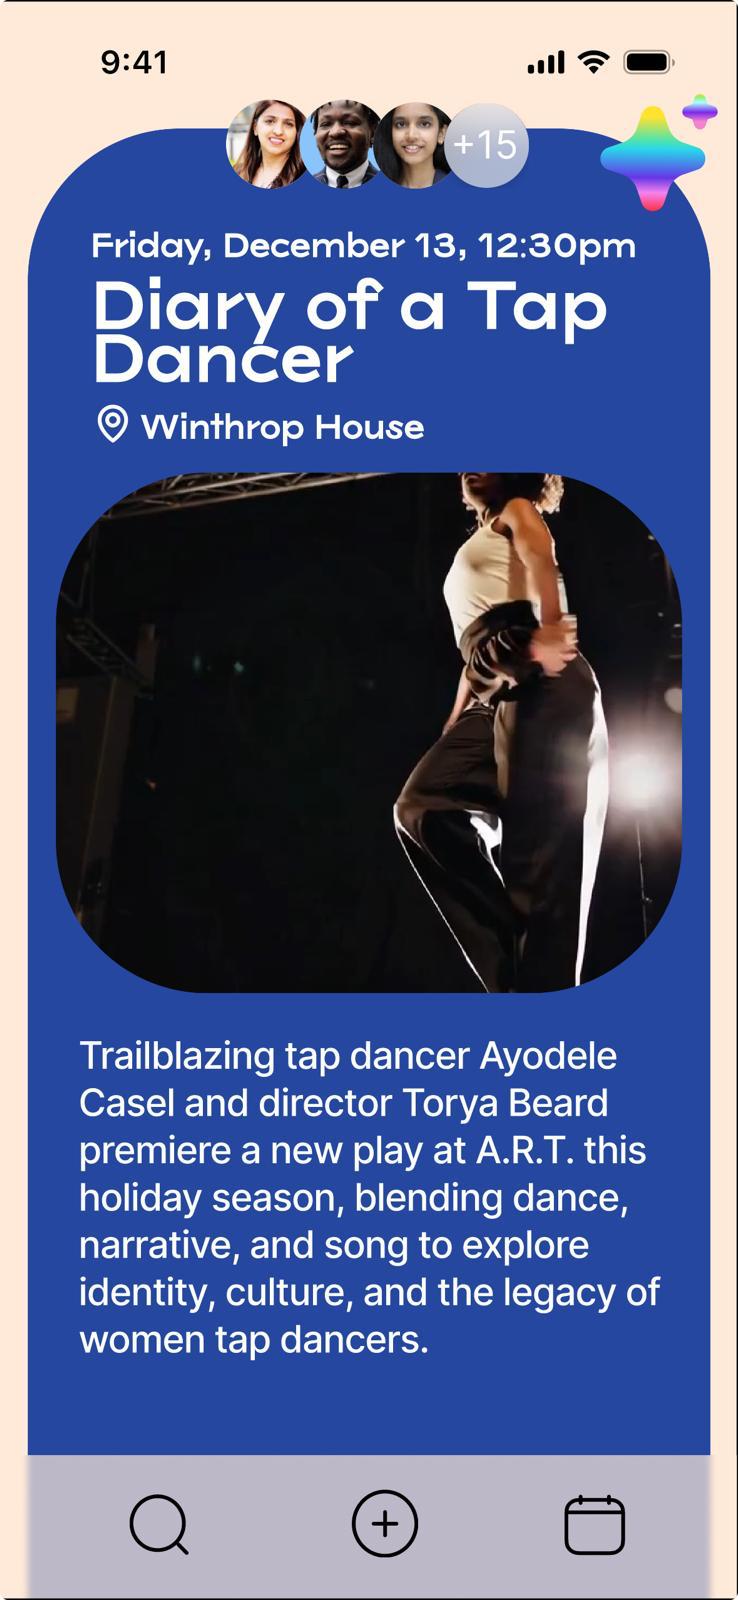
Remy Social Calendar event card for a performance at Winthrop House
Remy rendered every campus event as a rich card with attendee faces, pulled from fragmented school calendars.
Campus Dating icon

Campus Dating

2025

A campus scoped connection app built for one clear job, getting students to meet in person.

Outcome
Thousands of signups within weeks of the first campus launch and more than 10,000 students across campuses with no paid media.
What it settled
Density and a sharp use case unlocked the growth the earlier products could not reach.
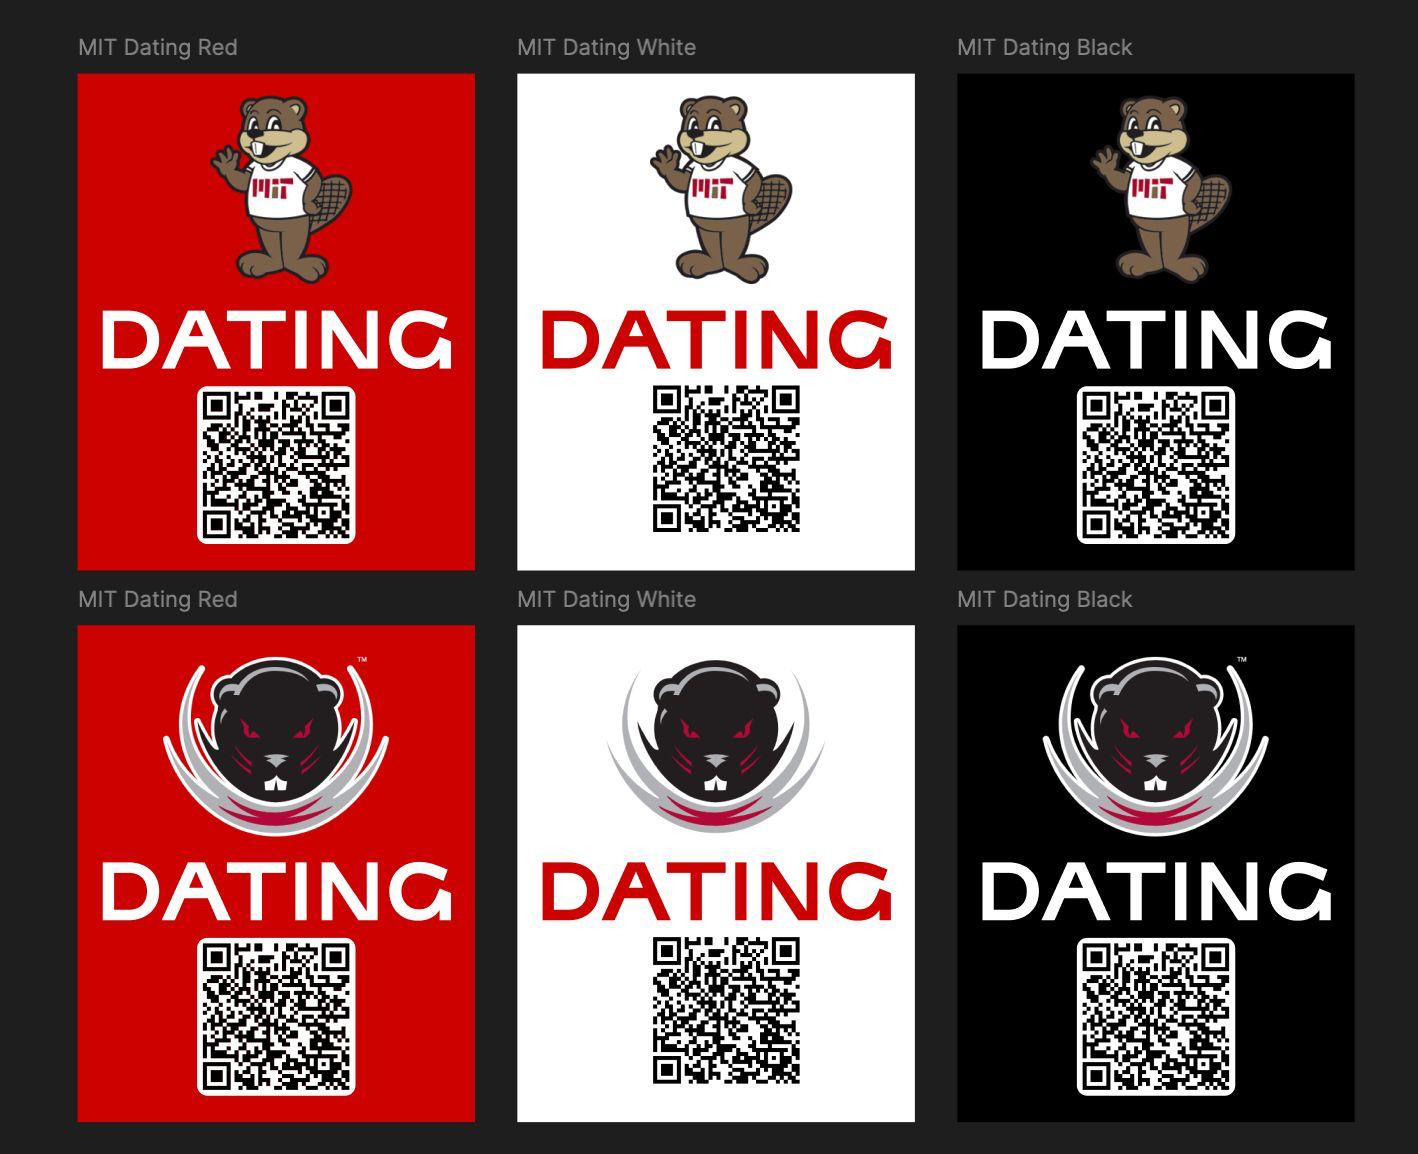
Campus Dating flyer variants produced for the MIT launch
Flyer variants produced per campus. Each colorway and mascot was tested for scan rate before a print run.

Go to market

Growth came from physical distribution on single campuses.

Every campus launch was run the same way so results could be compared. Print a coded flyer, saturate the highest traffic locations, talk to students directly, then read the funnel.

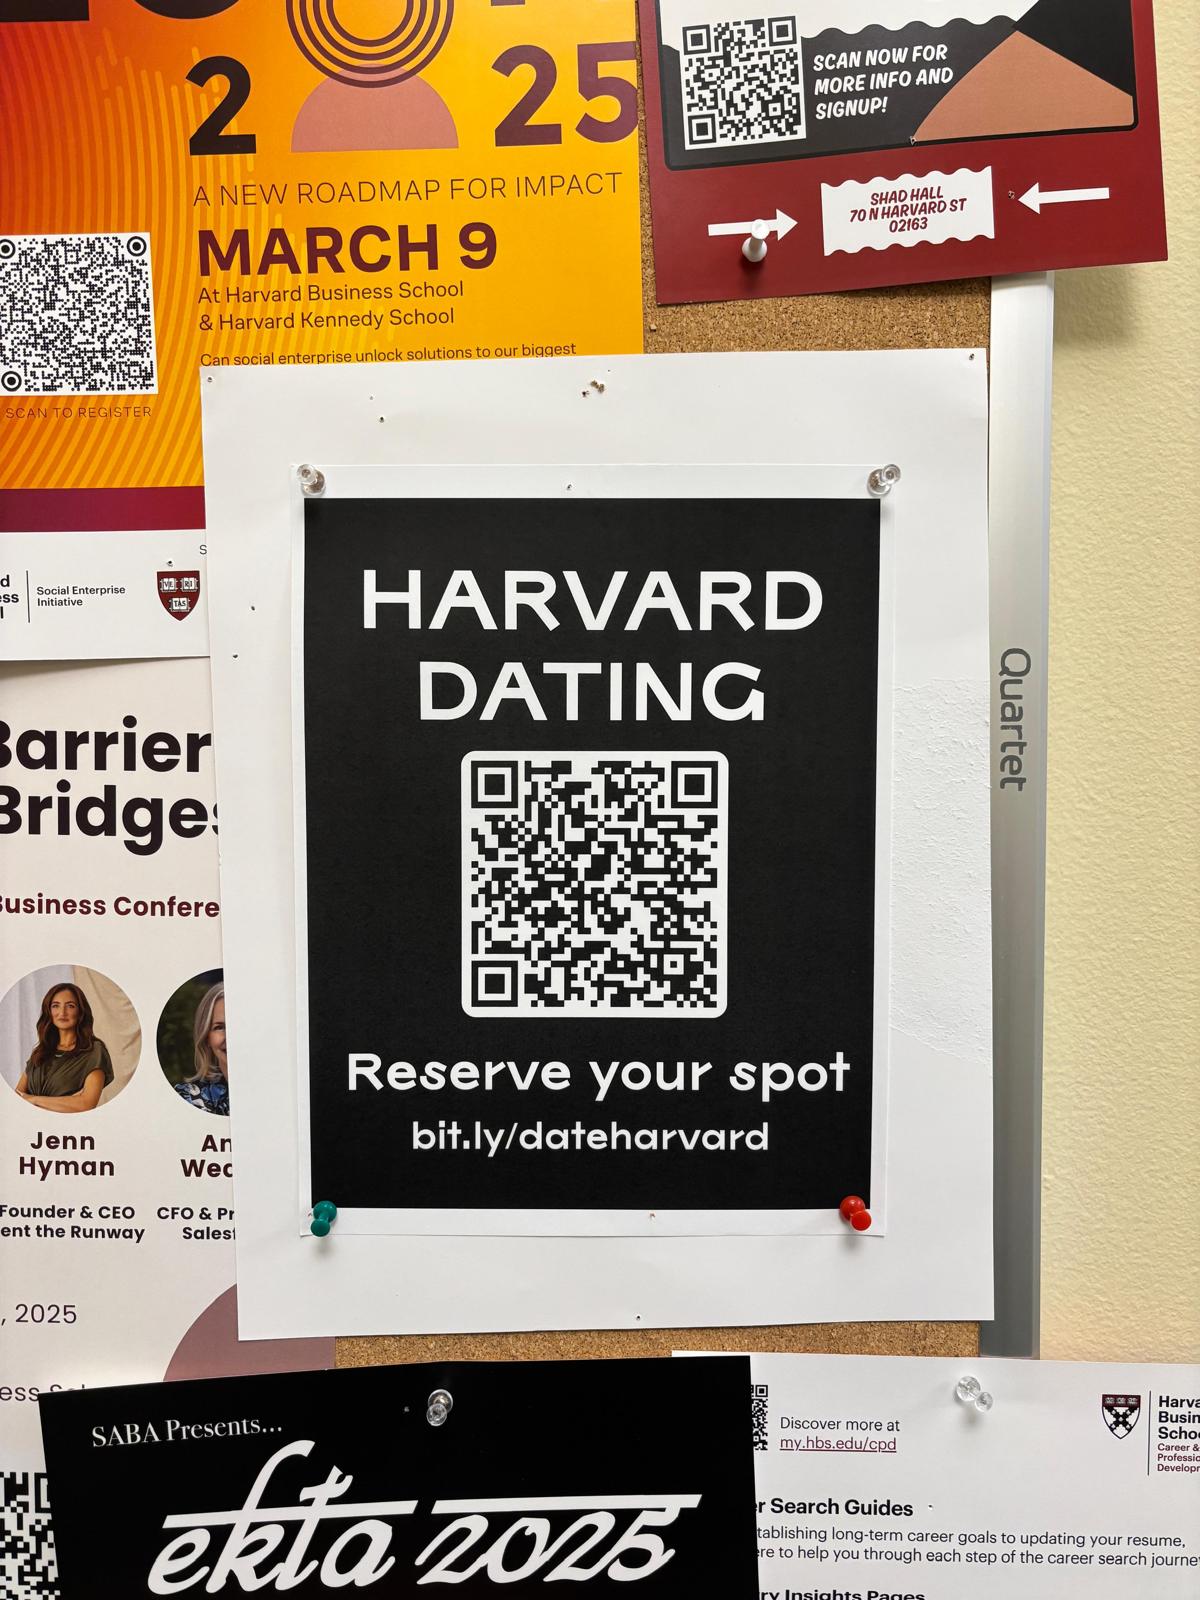
Campus flyer on a Harvard notice board
Coded flyers on campus notice boards. Each placement carried its own scan destination.
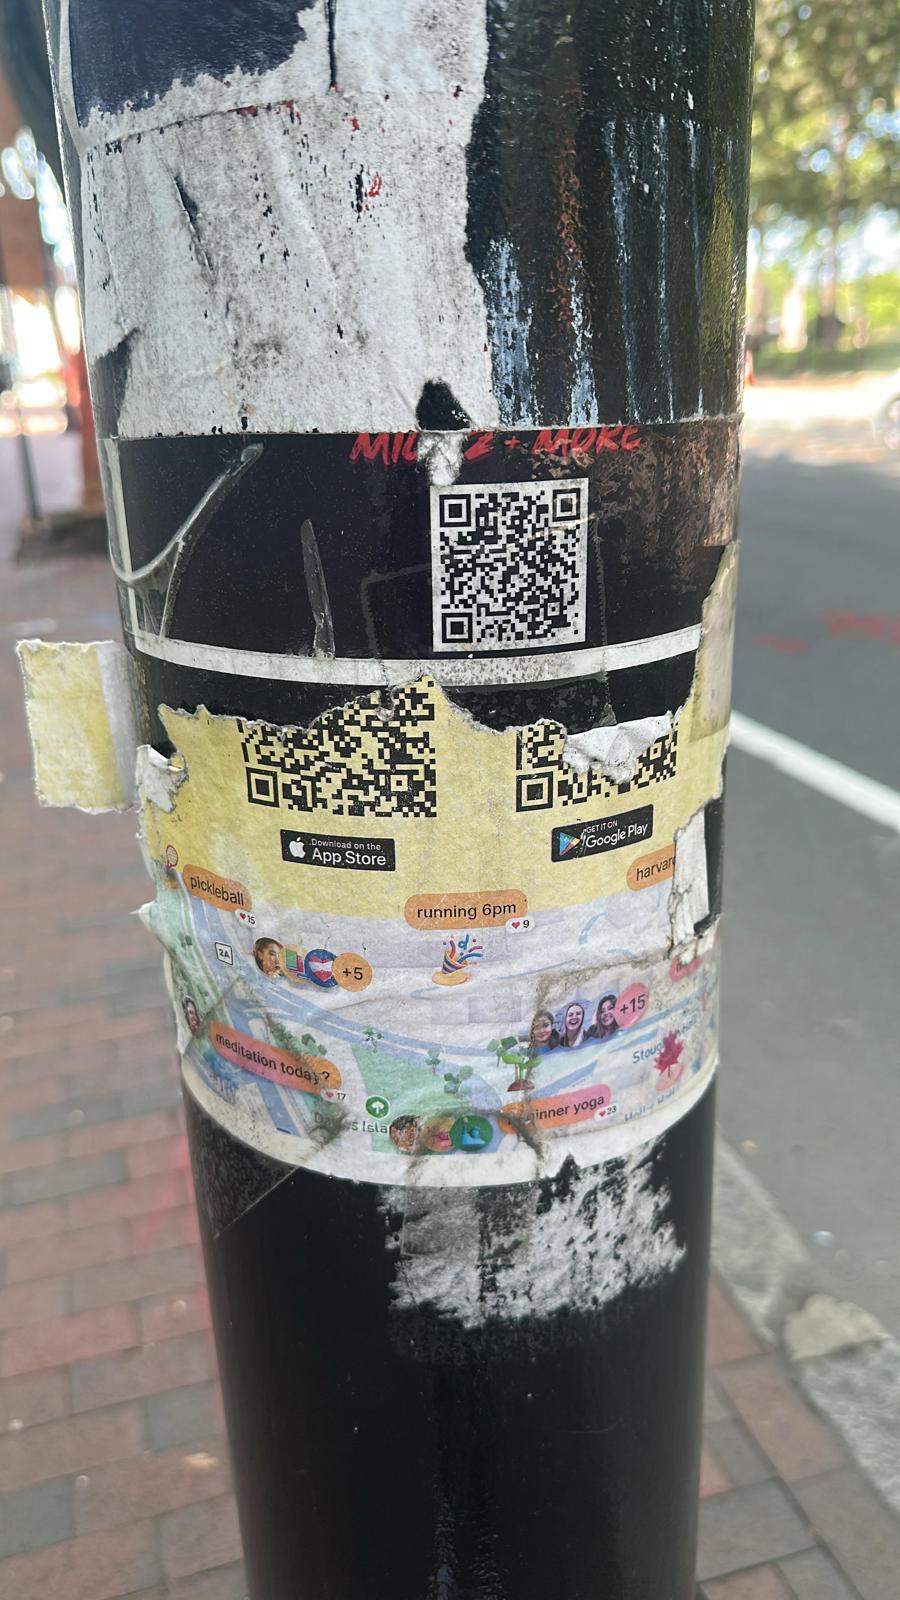
Weave flyer on a street post in Cambridge
Street level placement in Cambridge for the community app.
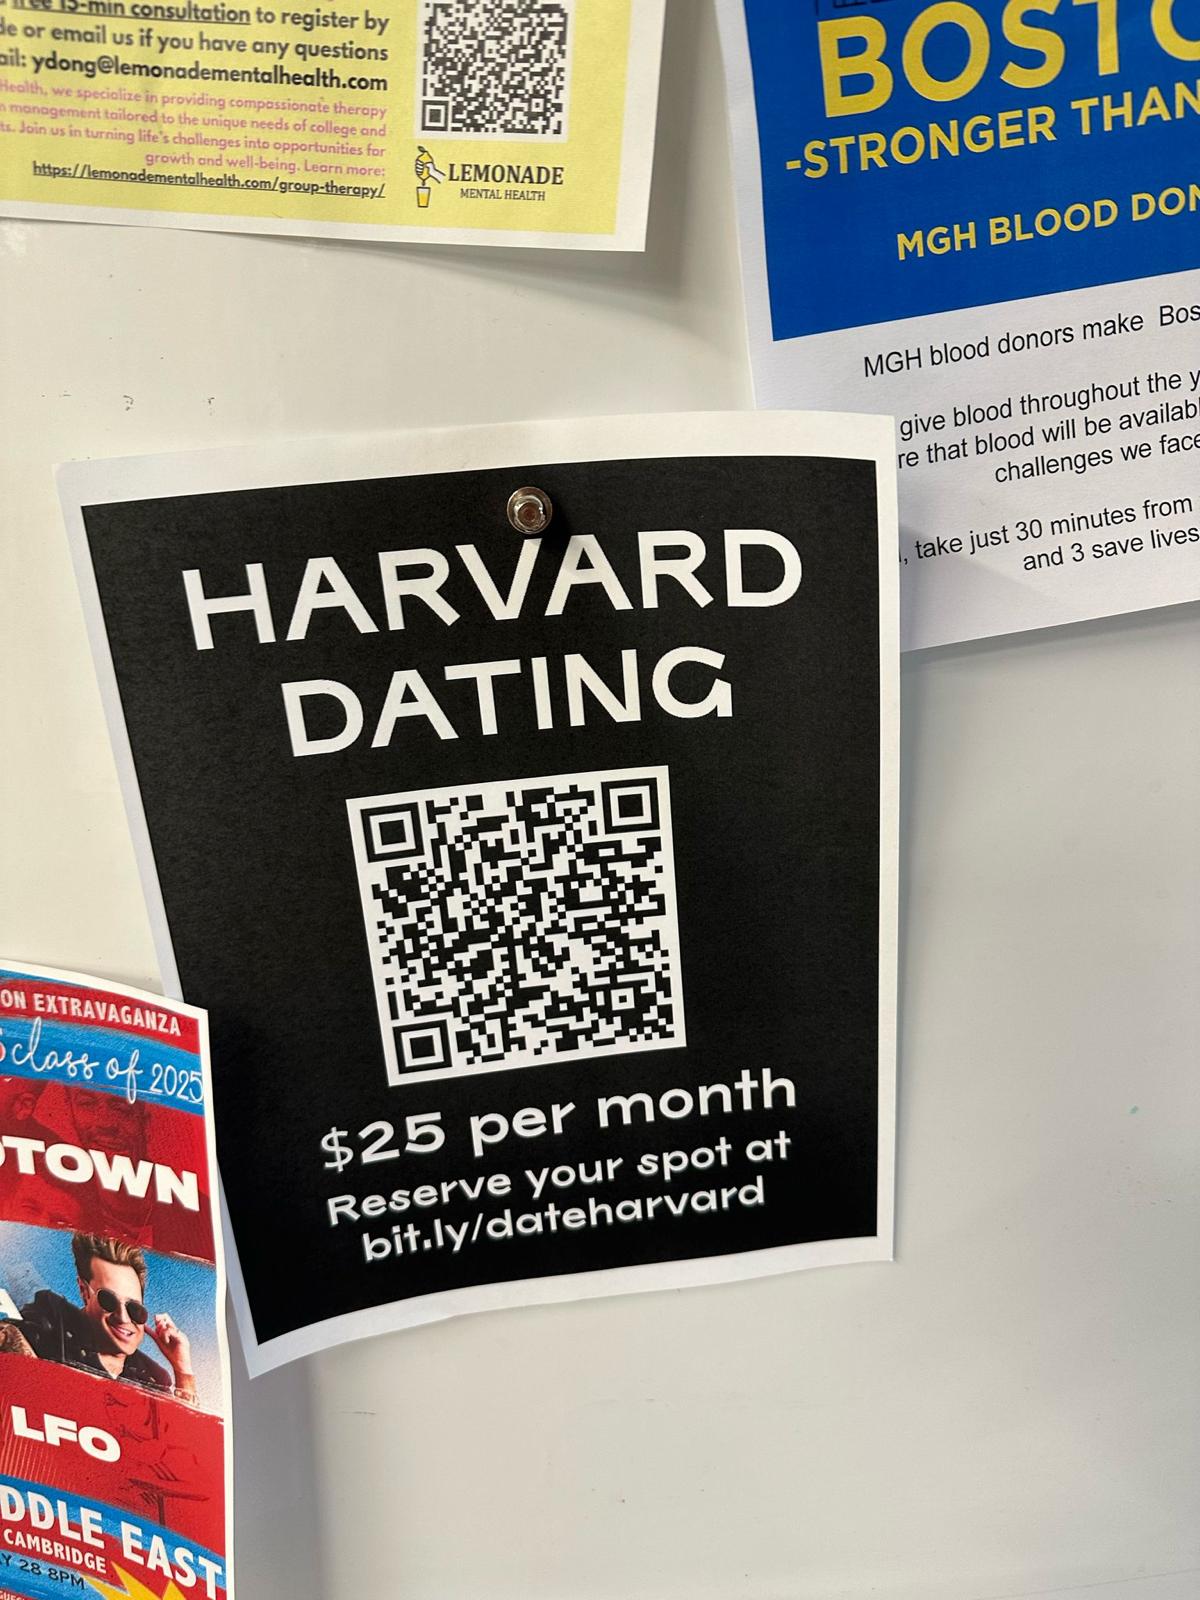
Campus dating flyer showing a price point
Pricing was tested directly on the flyer before it was ever built into the product.
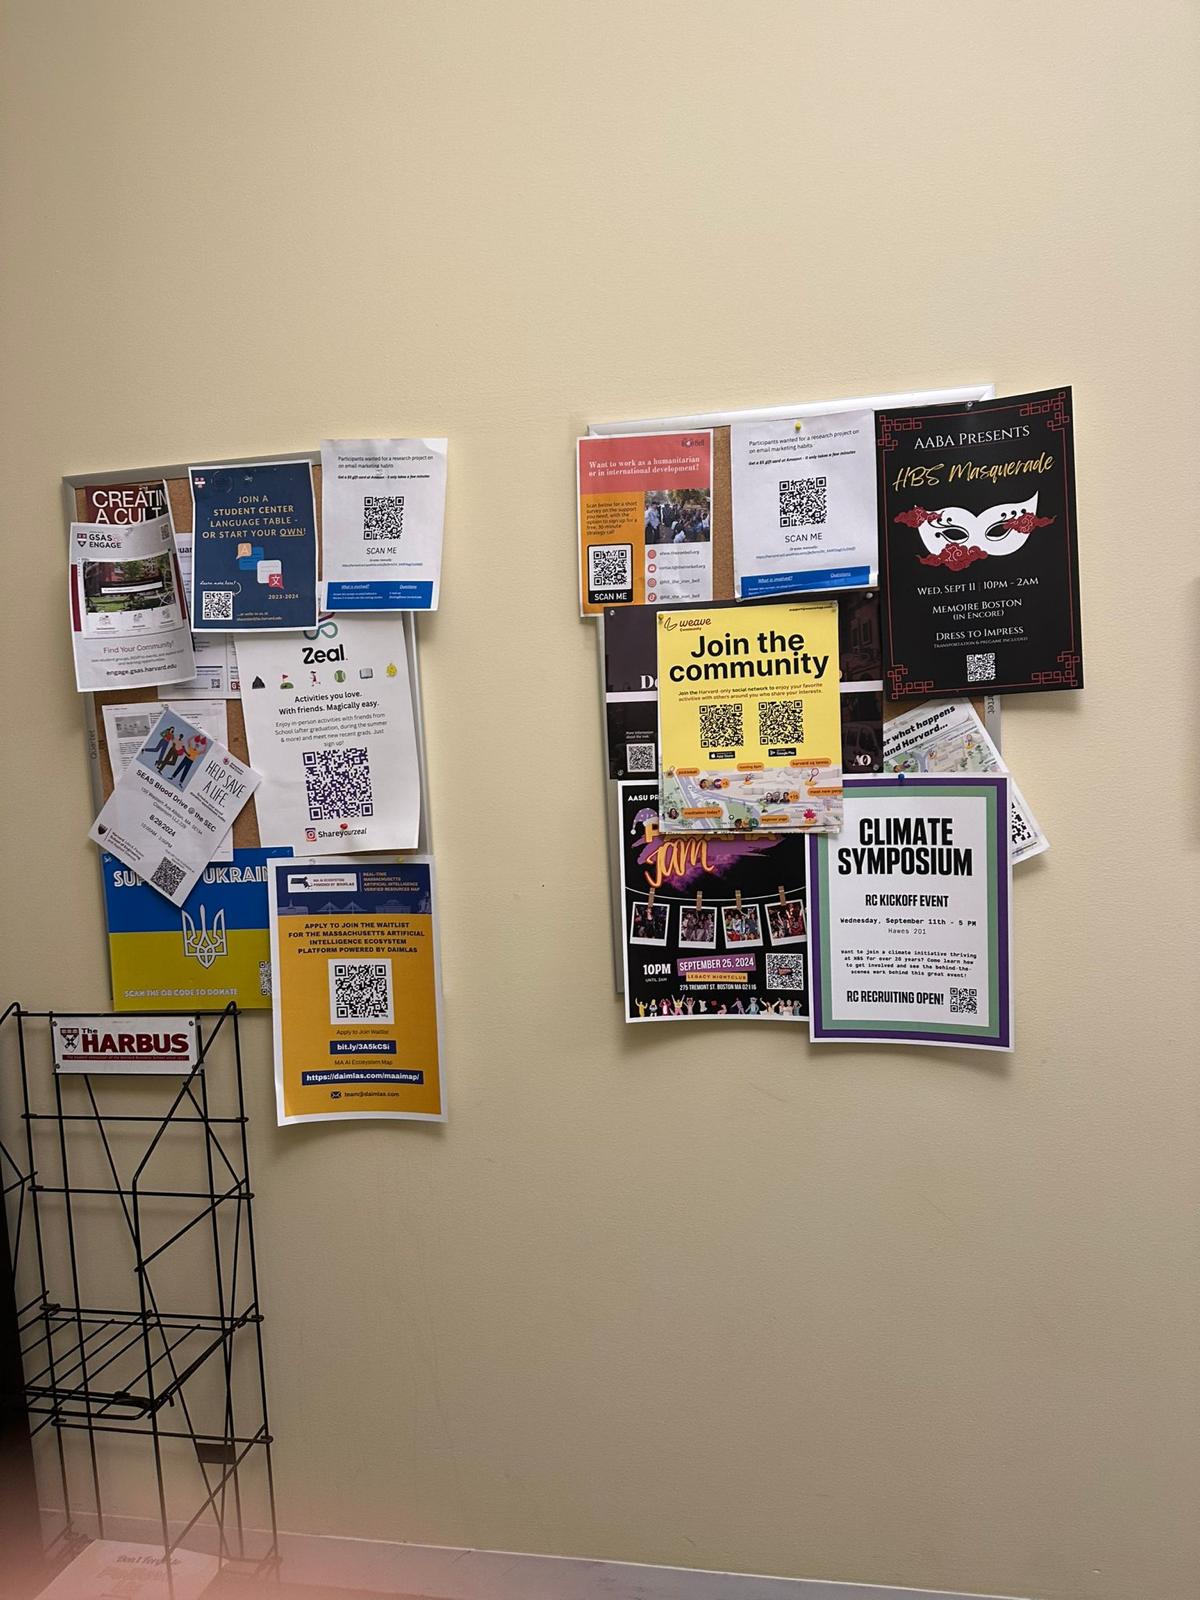
Weave flyer among campus bulletin boards
Weave flyers competed for attention on the same boards as every other campus organization.
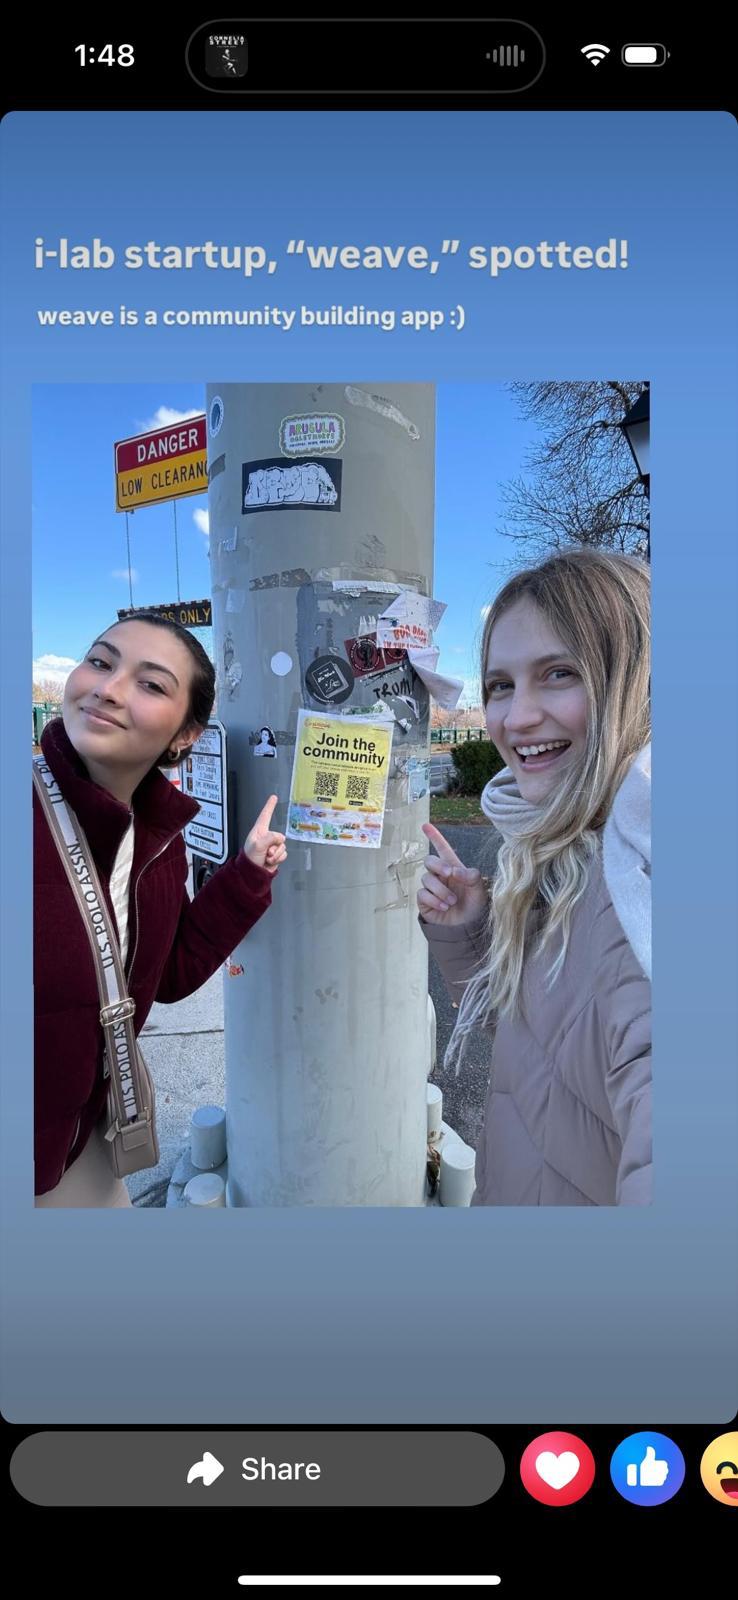
Students posting about spotting a Weave flyer
A student post after spotting a flyer in the wild. Physical placement generated its own word of mouth.

Density over reach

One campus at a time until the network was usable, rather than thin coverage everywhere.

Coded placements

Separate scan destinations per location made it possible to compare dining halls, dorms and libraries.

Direct conversation

Team members and student ambassadors onboarded users in person during high traffic moments.

Measurement

Every campus was tracked as a funnel and every week of users as a cohort.

Signup totals hide the thing that decides whether a consumer product works. The team instrumented six stages per campus and weekly retention curves per cohort, then compared them side by side.

CampusFlyer scansSignupsProfile completeActivatedReferred a friendDay 7 return
Harvard4,2002,1401,290780240215
MIT3,1001,520910560175150
Boston University3,6001,8101,080640190175
Northeastern2,9001,420855500145135
Boston College2,1001,04062036010595
Yale1,8008905353109080
All campuses17,7008,820 50%5,290 60%3,150 60%945 30%850 27%

Campus level figures are representative of internal tracking across the 2025 launches and are shown to illustrate the method rather than to report audited totals.

Weekly cohort retention

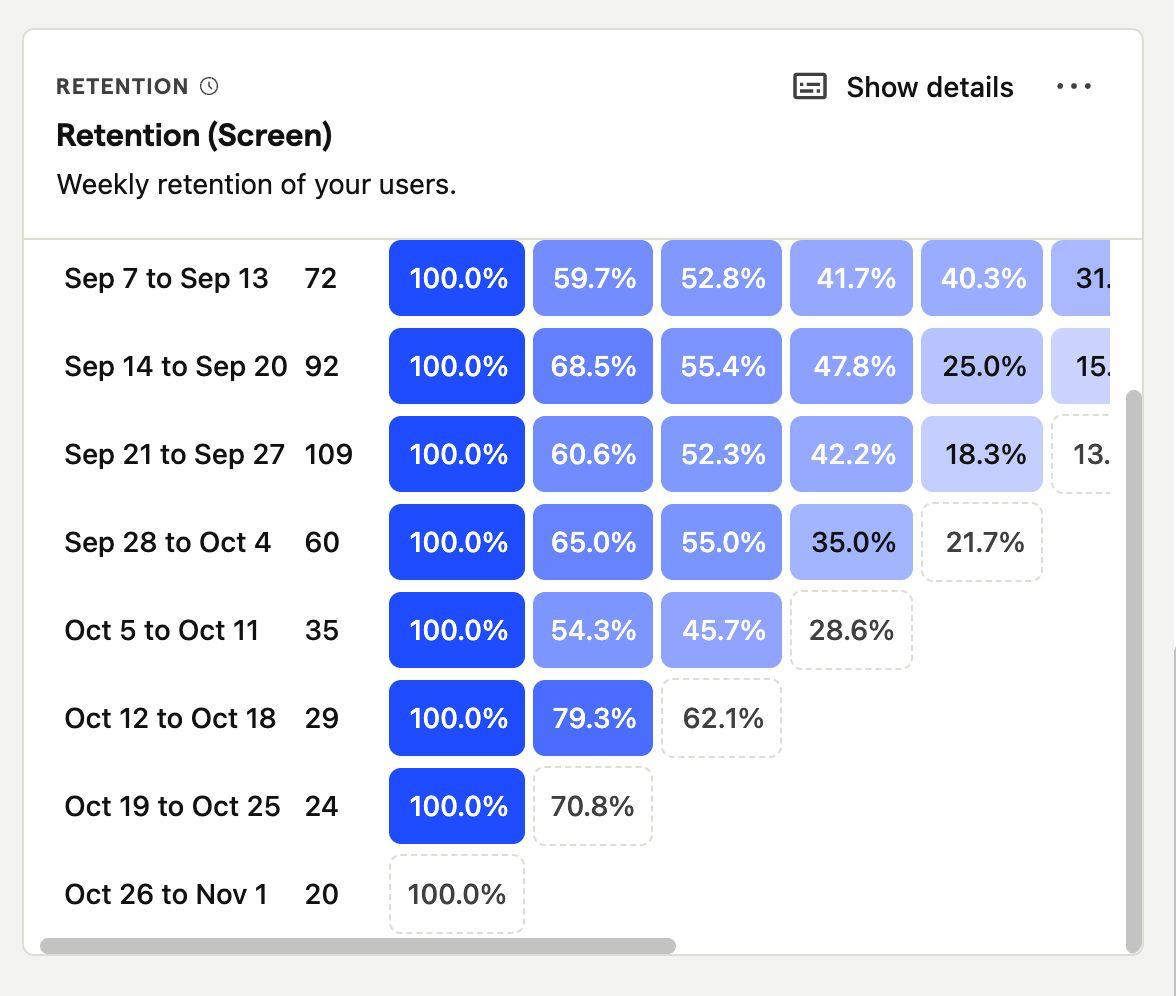
Each row is a weekly signup cohort and each column is the share of that cohort still active in the following weeks. Later cohorts held better early retention, which is what justified continued campus expansion.

CohortUsersWeek 0Week 1Week 2Week 3Week 4Week 5
Sep 7 to Sep 1372100.0%59.7%52.8%41.7%40.3%31.9%
Sep 14 to Sep 2092100.0%68.5%55.4%47.8%25.0%15.2%
Sep 21 to Sep 27109100.0%60.6%52.3%42.2%18.3%13.8%
Sep 28 to Oct 460100.0%65.0%55.0%35.0%21.7%—
Oct 5 to Oct 1135100.0%54.3%45.7%28.6%——
Oct 12 to Oct 1829100.0%79.3%62.1%———
Oct 19 to Oct 2524100.0%70.8%————
Oct 26 to Nov 120100.0%—————
Weekly retention cohort table from the analytics dashboard
Weekly retention as tracked in the product analytics dashboard.
App Store analytics showing conversion rate and sessions
App Store performance during a campus launch window. Page conversion peaked at 21.5 percent against a category norm in the low single digits.
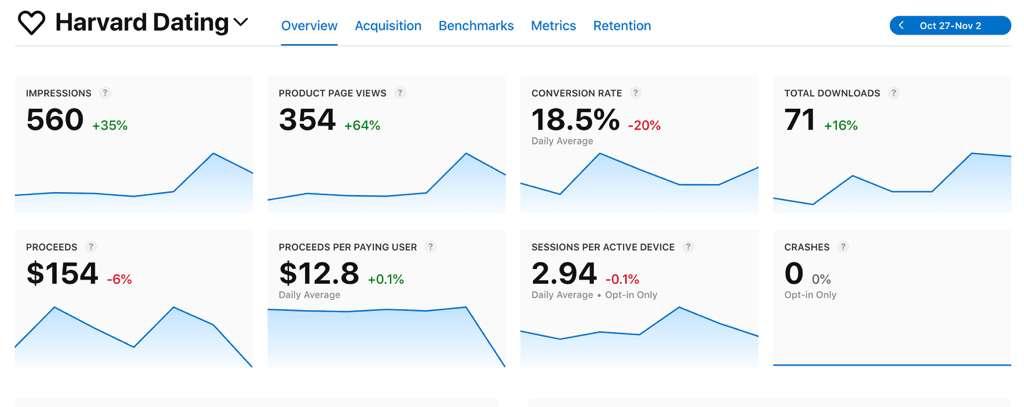
App Store analytics overview for a single week
A single week of store performance. Impressions, page views, conversion and downloads were reviewed weekly per campus.
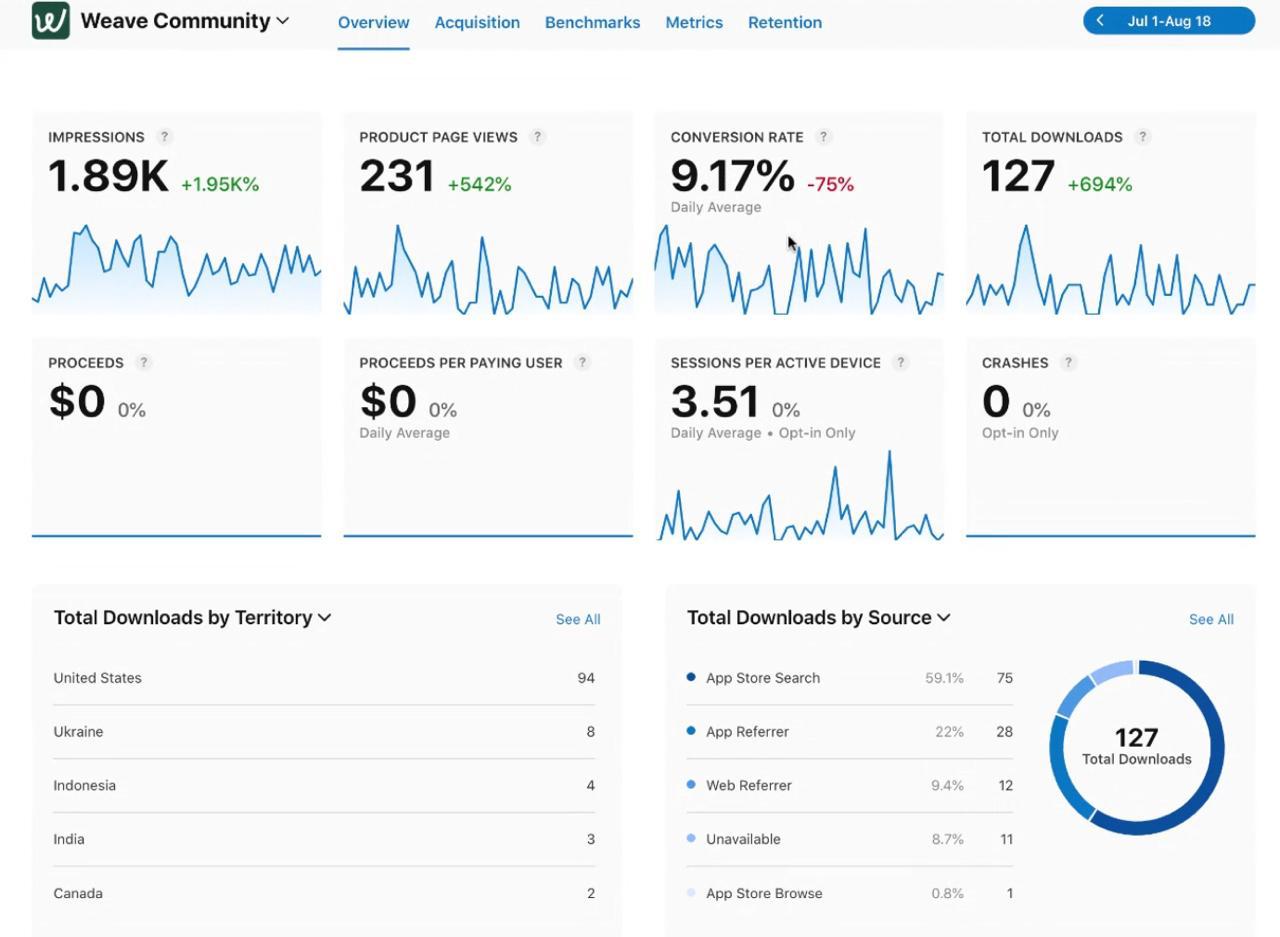
Weave Community App Store analytics dashboard
The earlier community product told a different story in the same dashboard. Downloads grew but repeat use stayed thin, which pushed the team toward narrower products.

Unit economics

What the unit economics analysis showed.

Once acquisition was proven, the question became whether a subscription could carry the business. The team modelled conversion, price, churn and the platform fee across three scenarios.

Bear case

Conversion
20% of activated users subscribe
Price
$15 per month
Churn
12% monthly
Average life
8.3 months
Lifetime value
$87 net of platform fee

Contribution never covers campus launch effort and support load.

Base case

Conversion
35% of activated users subscribe
Price
$15 per month
Churn
8% monthly
Average life
12.5 months
Lifetime value
$131 net of platform fee

Breaks even on infrastructure but not on the team required to keep launching campuses.

Bull case

Conversion
50% of activated users subscribe
Price
$25 per month
Churn
5% monthly
Average life
20 months
Lifetime value
$350 net of platform fee

Profitable per campus, but requires retention behaviour that a matching product structurally works against.

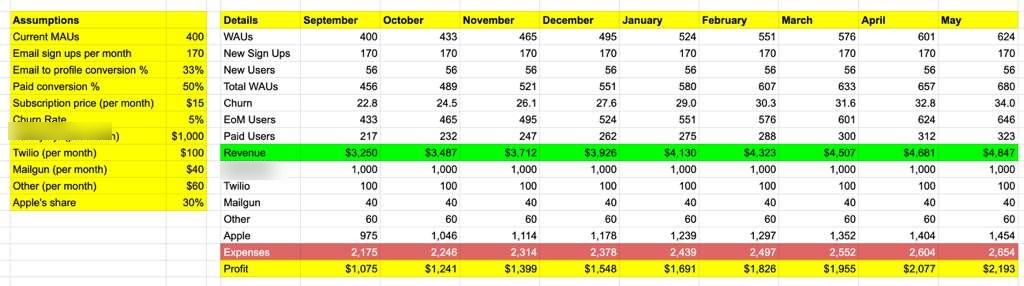
Monthly operating model spreadsheet
The operating model behind the scenarios. Monthly active users, signups, conversion, churn, subscription revenue, infrastructure cost and the platform fee.
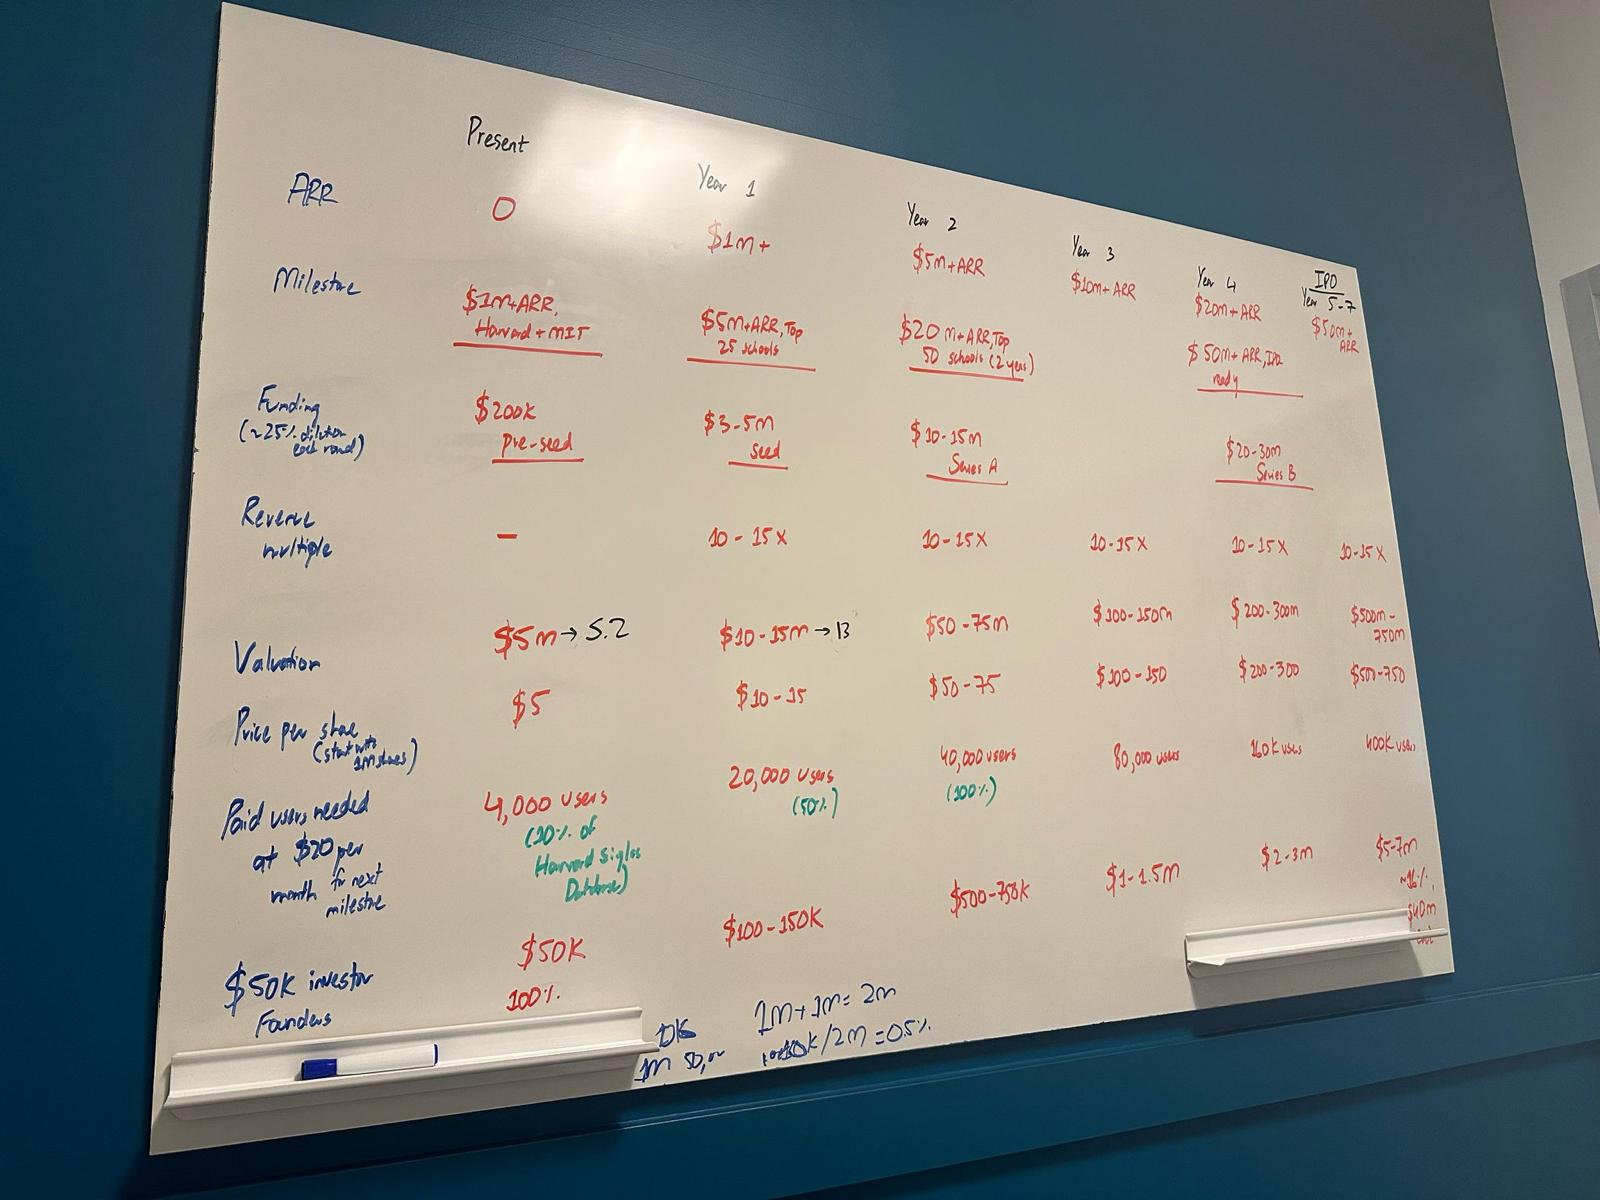
Whiteboard session mapping milestones, funding and valuation by year
Planning session mapping ARR milestones, funding rounds and the user counts each stage required.

The structural finding

In a matching product, success removes the customer. Every satisfied pair is churn, so lifetime value is capped by the thing the product is supposed to do well. With a thirty percent platform fee on subscriptions and a user base that turns over annually with graduation, the model only cleared its costs in the bull case, and the bull case required retention that the category works against.

With runway limited, the team chose to close rather than spend the remaining capital scaling a model the analysis did not support. The decision followed from the numbers.

Operating principles

Insights from two years of consumer experiments.

Validate faster than you polish

A rough product in real hands produces better information than a refined plan. Experiments were designed to reach live users within one to two weeks so decisions rested on observed behaviour rather than internal opinion.

A sharp wedge beats a broad platform

Products that serve everyone retain no one. Weave Community tried to hold events, discovery, messaging and civic action at once. Campus Dating held one job. The difference in traction was not marginal.

Measure the whole funnel, not the top

Scans, installs, profile completion, activation, referral and day seven return were tracked separately by campus. Growth problems and retention problems look identical in a signup count and completely different in a funnel.

Respect the economics early

Acquisition strength can disguise a structurally unprofitable model. Modelling conversion, price, churn and platform fees before scaling spend is what turned a hard outcome into a deliberate decision.

Team

The team behind Weave.

Product, engineering, design, community and brand, built to run consumer experiments end to end.

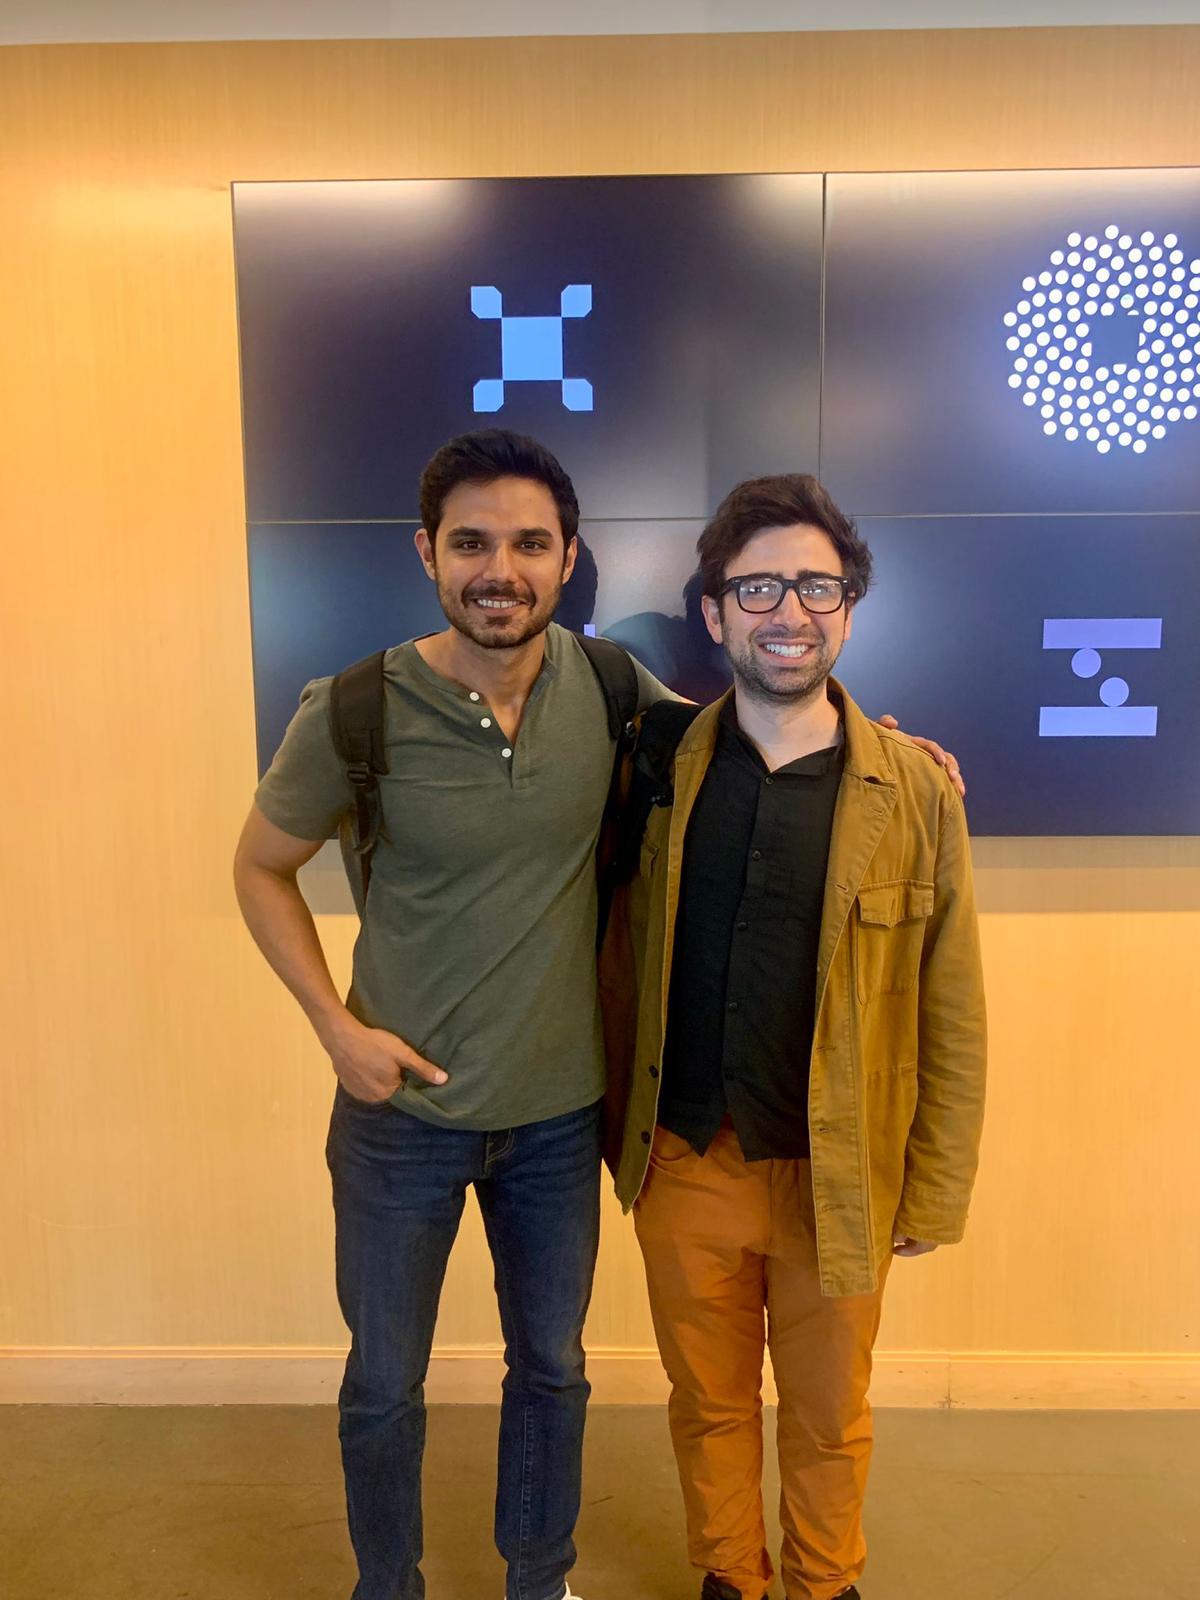
The two co-founders of Weave
The co-founders during the Weave Community product cycle.
Team members during a focus group session in the studio
Focus group and interview sessions were run in person throughout the product cycle.
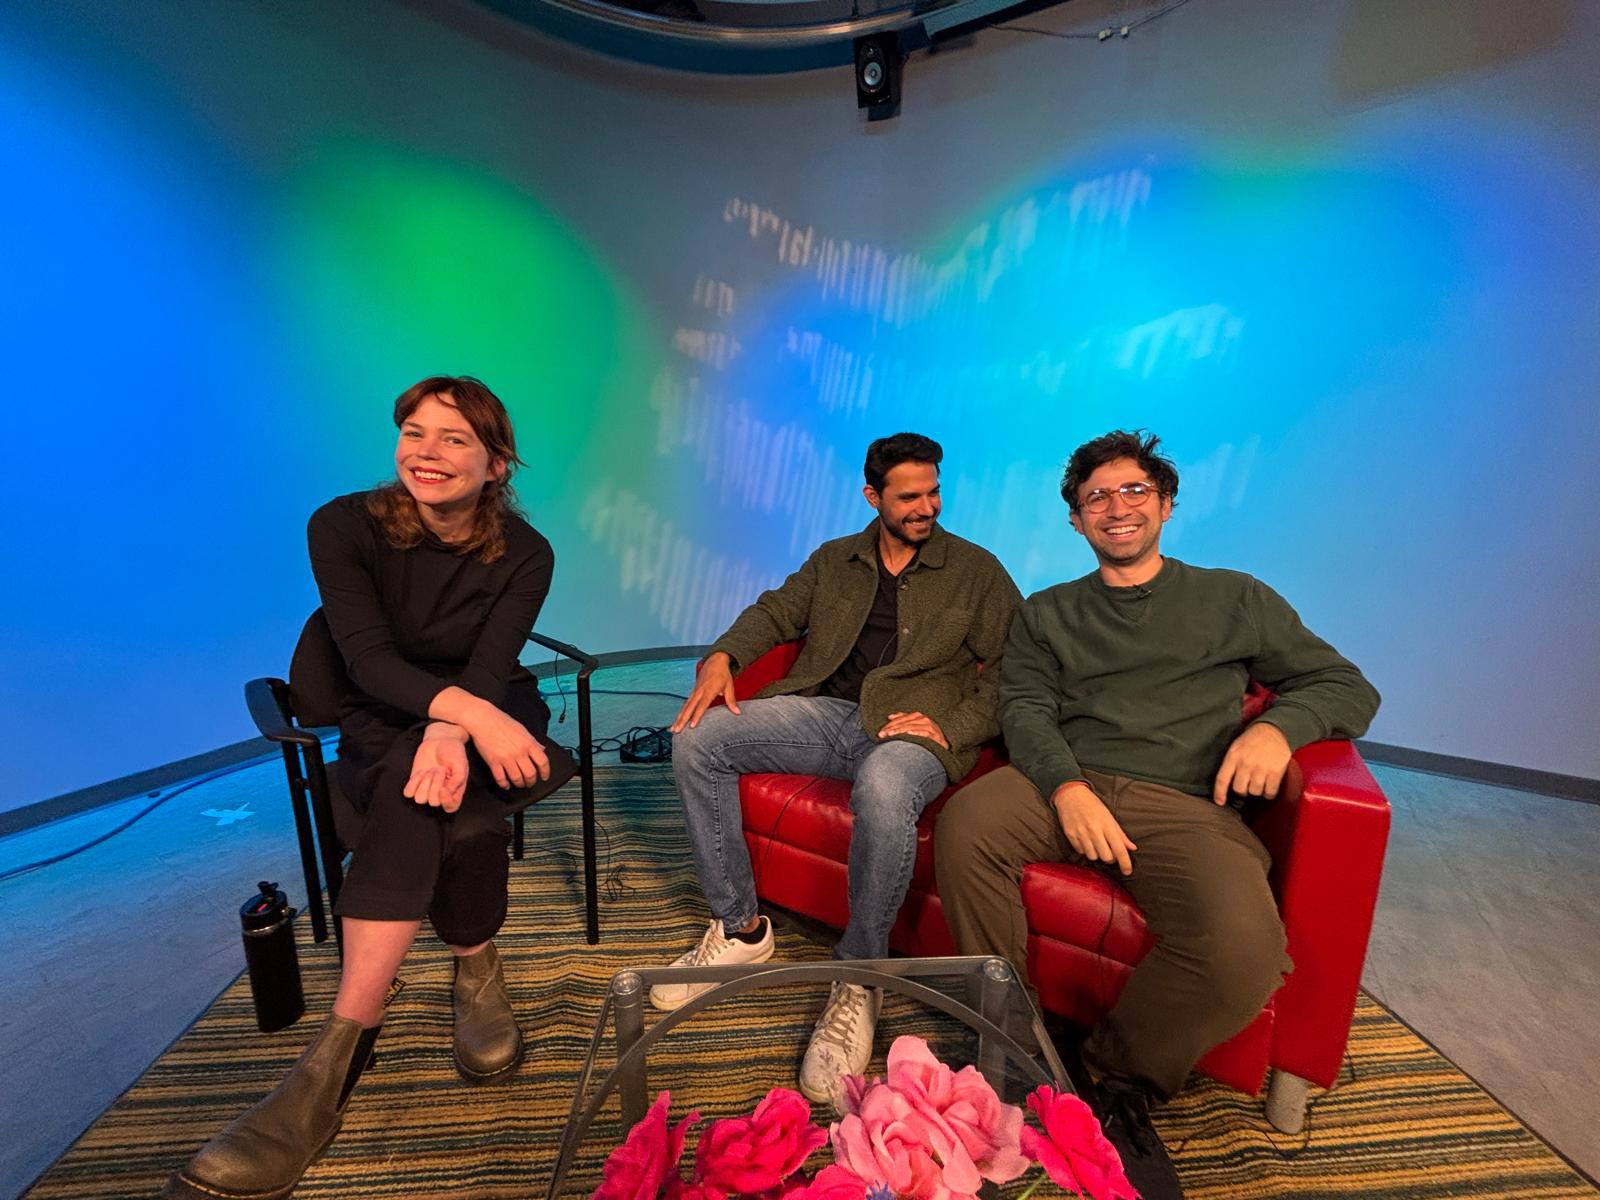
A focus group with students at the Harvard i-lab
A focus group with students at the Harvard i-lab, where the company was based.
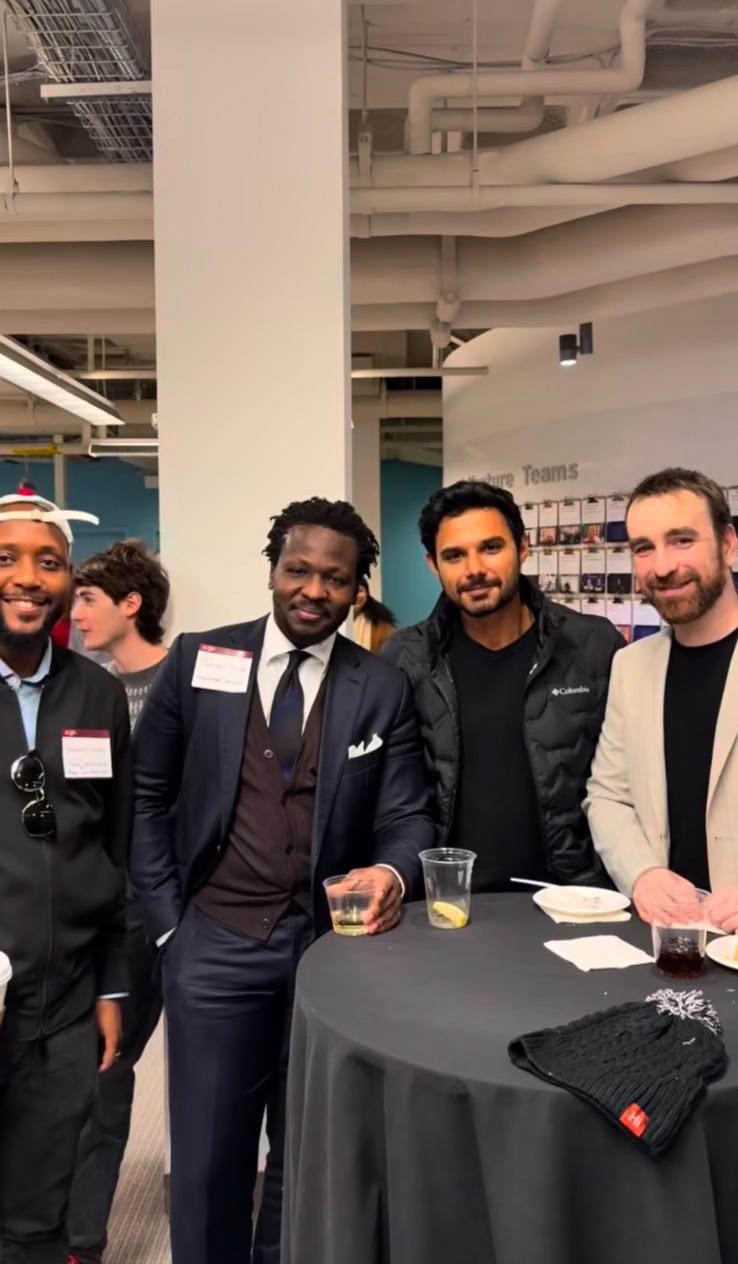
Team members at an i-lab cohort event
With the i-lab cohort at a community event.
Umer Iqbal
Co-founder
MBA Wharton, MPA Harvard. Former management consultant.
Benjamin V.
Co-founder
M. Design Engineering, Harvard. Rebooting Social Media fellow.
John Hoffer
Chief Technology Officer
Harvard College.
Sofia M.
Project Manager
Delivery and release operations.
Divyanka K.
Product Consultant
M. Des. Eng. Harvard. Ex Amazon, ex Facebook.
Volodymyr G.
Tech Specialist
Mobile and backend engineering.
Mudabbir J.
Community Specialist
Harvard Graduate School of Education.
Trey Malik Cruz
Branding Consultant
Two time founder. Harvard Extension School.